
Figure 2 (Continued).
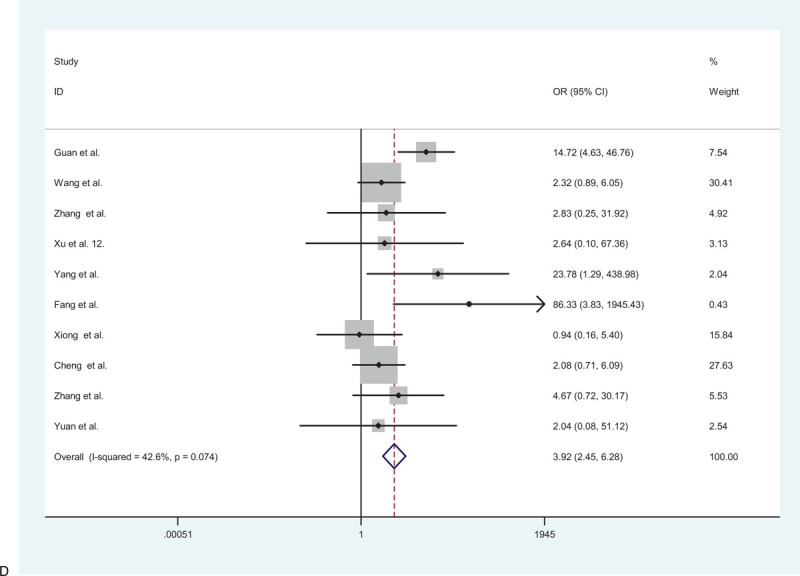
(A) Forest plot for the association between hypertension and severe patients and non-severe patients. (B) Forest plot for the association between diabetes and severe patients and non-severe patients. (C) Forest plot for the association between cardiovascular disease and severe patients and non-severe patients. (D) Forest plot for the association between cerebrovascular disease and severe patients and non-severe patients. (E) Forest plot for the association between respiratory system disease and severe patients and non-severe patients.