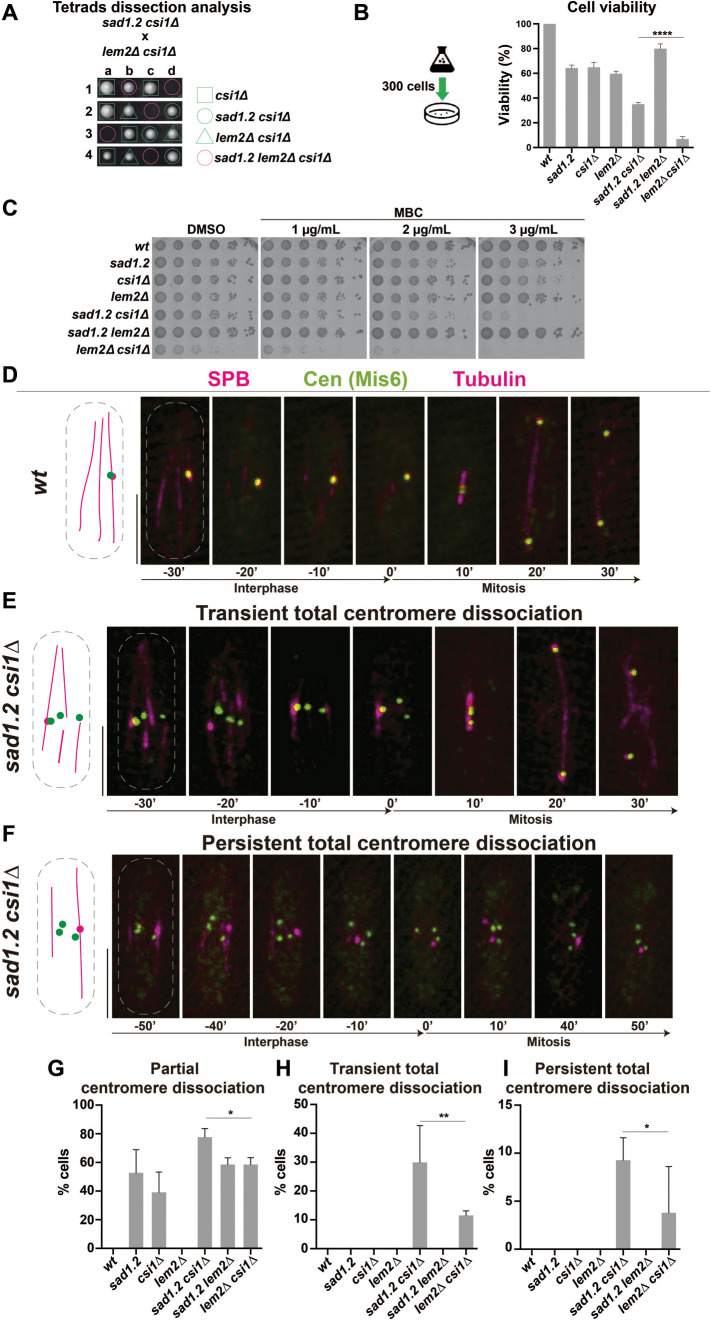
FIGURE 1:
Loss of Csi1 in sad1.2 cells leads to a higher rate of Rabl configuration-deficient cells. (A) Tetrad analysis of h- sad1.2 csi1∆ crossed with h+ lem2∆ csi1∆ shows a strong negative genetic interaction between sad1.2, lem2∆, and csi1∆ when spores harbor the three mutations. Spores were grown at 32°C for 5 d. (B) Cell viability relative to wt cells was evaluated by colony formation assays. Cells were cultured in liquid medium to 107 cells/mL, 300 cells spotted onto YE4S plates, and incubated at 32°C for 5 d (n > 500 colonies per genotype were scored in four independent experiments). Data were subjected to Fisher’s exact test; ****, p-value < 0.0001. (C) Serial dilutions (fivefold) of log-phase cultures were spotted and grown on rich media with DMSO (control) and rich media containing MBC. Plates were incubated at 32°C for 48 h. (D–F) Frames from films of proliferating cells carrying Sid4-mCherry (endogenously tagged; SPB), Mis6-GFP (endogenously tagged; centromeres), and ectopically expressed mCherry-Atb2 (tubulin). Scale bar represents 5 µm. (G–I) Centromere–SPB association patterns. >30 cells were scored for each genotype in at least three independent experiments. p-values were determined by Fisher’s exact test; **, 0.001< p < 0.01; *, 0.01< p < 0.05.

