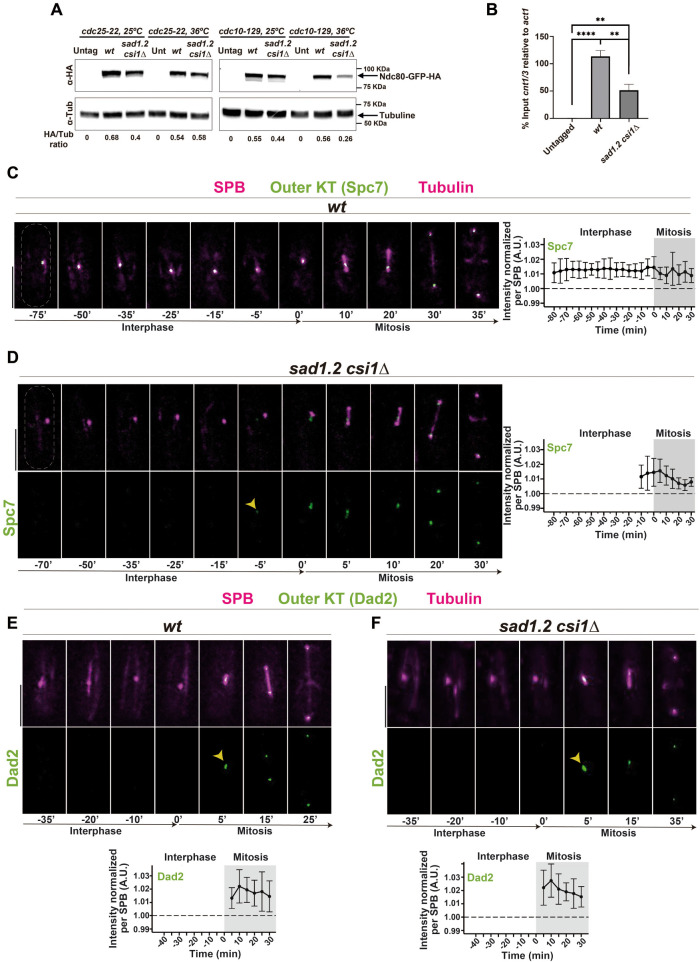
FIGURE 4:
Rabl configuration-deficient cells efficiently complete outer kinetochore assembly. (A) Western blot analysis of protein samples from cells synchronized in G2/M (left) or G1 (right). Labels to the left indicate the antibodies used to probe the blots. The data shown are from a single representative experiment out of two repeats and quantifications from below are the averages of the HA signal relative to the tubulin control from two independent experiments. (B) ChIP analysis of Ndc80 levels at centromeres 1 and 3 in cells synchronized in G1. Error bars represent standard deviations of three biological replicates. p-values were determined by t test, **** p < 0.0001, ** p < 0.005. (C–F) Frames from films of mitotic cells carrying SPB and tubulin markers as in Figure 2, and endogenously tagged Spc7-GFP, C, D, or Dad2-GFP, E, F. Bars, 5 µm. Means of total Spc7-GFP and Dad2-GFP intensities were quantified as in Figure 2. Ten cells during more than three independent experiments were quantified. Error bars represent standard deviations; t = 0 min is just before the separation of the SPBs.

