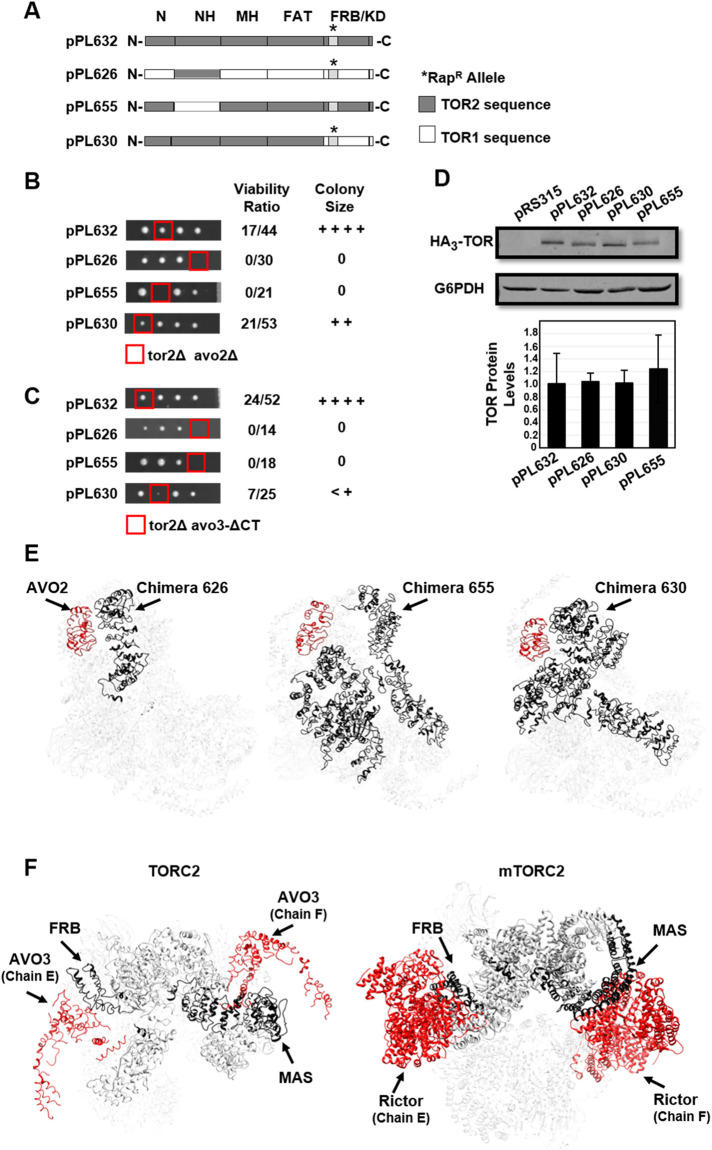
FIGURE 2:
Synthetic genetic interactions involving TORC2 components. (A) Chimeric TOR1-TOR2 genes constructed for this study. Plasmid pPL632 expresses full-length TOR2. Plasmid pPL626 expresses the TOR2 MAS domain within the context of TOR1. The reciprocal chimera, pPL655, expresses the TOR1 MAS domain within the context of TOR2. Plasmid pPL630 expresses the complete N-terminal region of TOR2, including the FAT domain, but contains the TOR1 FRB and kinase domains. Where indicated, constructs harbor the rapamycin resistance mutation (RapR); this mutation corresponds to the TOR1-1 allele (S1972R) for sequences corresponding to TOR1 and the TOR2-1 allele (S1975R) for sequences corresponding to TOR2. (B) Chimeras described in A were introduced into a double heterozygous TOR2/tor2Δ AVO2/avo2Δ strain, followed by sporulation and tetrad dissection. Viable haploid progeny were genotyped by growth on selective media (see Materials and Methods). Viability was determined based on the number of tor2Δ avo2Δ haploid progeny that carried a plasmid compared with total tor2Δ progeny that carried a plasmid. The relative colony size was assessed following incubation at 30°C for 2 d on YPD solid media. ++++ corresponds to wild-type growth, and 0 corresponds to no growth. (C) Chimeras described in A were introduced into a double heterozygous TOR2/tor2Δ AVO3/avo3-Δ CT strain, followed by sporulation and tetrad dissection. Viable haploid progeny were genotyped by growth on selective media (see Materials and Methods). Viability was determined based on the number of tor2Δ avo3-Δ CT haploid progeny that carried a plasmid compared with total tor2Δ progeny that carried a plasmid. The relative colony size was assessed as in B. (D) Western blot analysis of TOR1-TOR2 chimeras. The indicated plasmids were introduced into a TOR2/tor2Δ heterozygous diploid strain (lanes 2–5). Cells were grown to mid–log phase in selective media, and protein extracts were prepared and analyzed by SDS–PAGE and immunoblotting. Blots were probed with anti-HA to detect plasmid-expressed TOR chimeras or anti-G6PDH (Zwf1) as a loading control. Plasmid pRS315 is an empty control vector. TOR protein levels were quantified following normalization to the G6PDH signal and represent averages of three independent experiments (± SD). (E) Modeling TOR2-specific regions in the TOR2 MAS domain (pPL626) (left panel) or TOR1 MAS domain (pPL655) (right panel) chimeras, respectively. TOR2-specific regions are highlighted in gray in the schematic diagrams and are shown in black in the Cryo-EM model for TORC2 (Karuppasamy et al., 2017). AVO2 is shown in red. Protein chains are labeled according to nomenclature described in Karuppasamy et al. (2017). (F) Left panel: TOR2 MAS and FRB domains within TOR2 (chain A) are shown in black and both copies of AVO3 are shown in red within the Cryo-EM model for TORC2 (Karuppasamy et al., 2017). Proximities between the FRB domain and one copy of AVO3 (chain E) and between the MAS domain and the second copy of AVO3 (chain F) are apparent. Protein chains are labeled according to nomenclature described in Karuppasamy et al. (2017). Right panel: mTOR MAS and FRB domains within mTOR (chain A) are shown in black and both copies of Rictor are shown in red within the Cryo-EM model for mTORC2 (Scaiola et al., 2020). Proximities between the FRB domain and one copy of Rictor (chain E) and between the MAS domain and the second copy of Rictor (chain F) are apparent. Protein chains are labeled according to nomenclature described in Scaiola et al. (2020).

