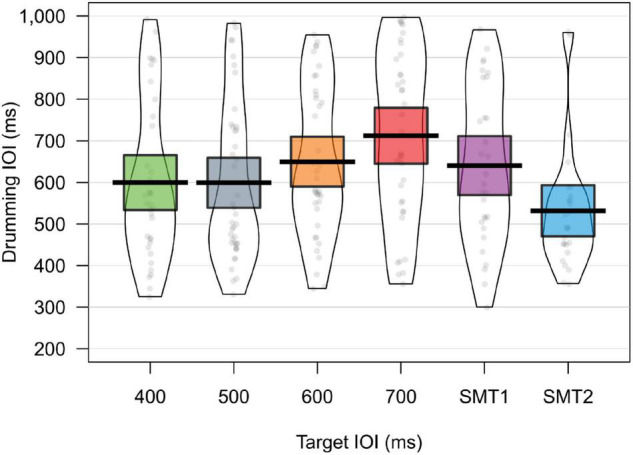
FIGURE 4.

Figure shows violin plots and jittered raw data of the rate of infant drumming in each experimental condition. The Mean is signified by a bold line, and the 95% CI is shaded. Whilst infant drumming does not directly correspond to the rate of presentation, infants appear to be adapting their rate of drumming to be slower in the slow trials (600 and 700 ms IOI).
