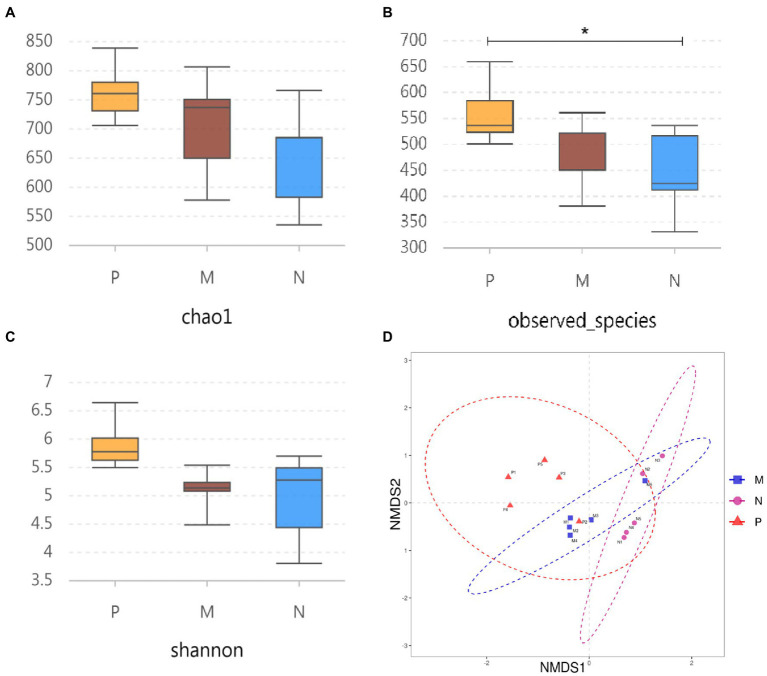
Figure 3.
α diversity analysis and β diversity of the three experimental groups were analyzed by sequencing the 16S rRNA gene. Chaol (A) and the observed number of species (B) were used as abundance estimates. The Shannon—Wiener index (C) was used as a diversity estimator. (D) NMDS was adopted to analyze the degree of difference between different samples to assess β diversity. The results were calculated for statistical significance using the t-test (N = 5/group). *P < 0.05. P, challenged H9N2 cells after pretreatment with PBS; M, challenged H9N2 cells after pretreatment with L. plantarum 0111. N, pretreatment with PBS.

