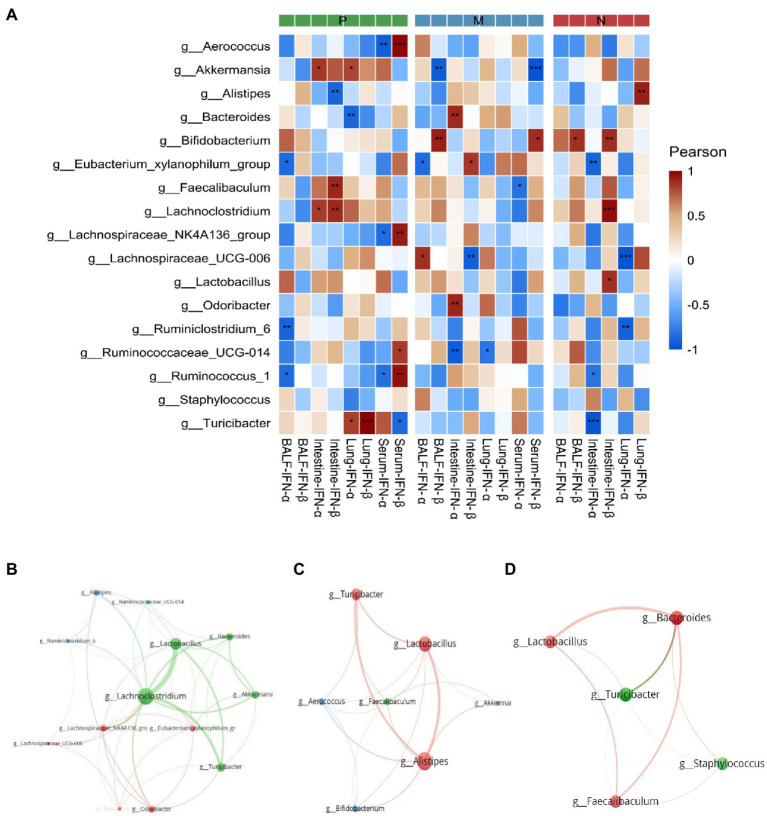
Figure 8.
The Pearson correlation between dominant bacterial genera and the transcription and expression of type I interferon (A) and the correlation between the dominant bacterial genera in groups P (B), M (C), and N (D) are shown in the correlation diagram. The P values were adjusted according to the Bonferroni and Hochberg procedures to determine the false discovery rate. Asterisks indicate a significant correlation between bacterial groups and type I interferon (*P < 0.05, **P < 0.01, ***P < 0.001). P, challenged H9N2 cells after pretreatment with PBS; M, challenged H9N2 cells after pretreatment with L. plantarum 0111; N, pretreatment with PBS.

