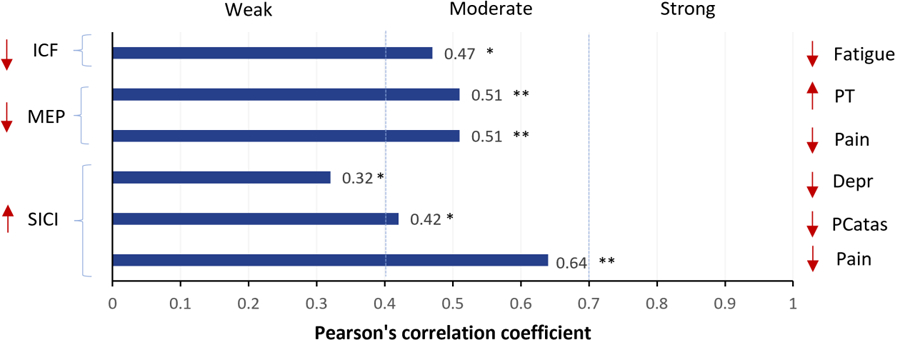
Figure 4. Pearson’s correlation betweenTMS metrics changes and clinical improvement.

Note: ICF and SICI data were extracted from 2 studies (Mhala et al. 2010 and 2011), the active intervention was M1 rTMS. MEP data was extracted from 1 study (Bement et al. 2014), the active intervention was exercise. *P < 0.05, **P < 0.01. Depr: depression; ICF: Intracortical facilitation; MEP: motor-evoked potential; Pcatas: pain catastrophizing; PT: pain threshold; SICI: short intracortical inhibition.
