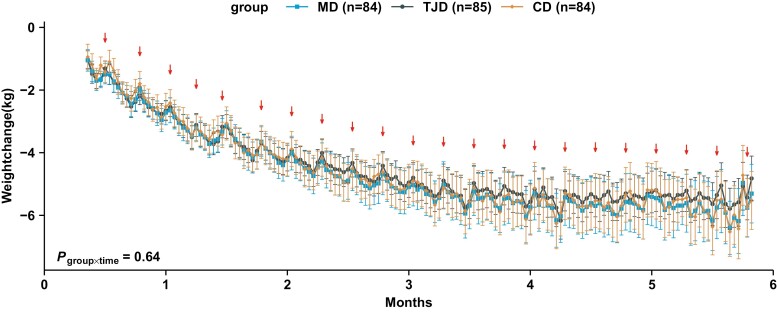
Figure 2.
Changes in body weight monitored by scales at home during the intervention. The within-group changes from baseline are presented as estimated marginal means (Mediterranean diet [MD], n = 84; traditional Jiangnan diet [TJD], n = 85; control diet [CD], n = 84). Error bars show 95% CI. ↓ represent rebounds at weekends or on holidays. P group × time was examined by mixed-effects linear models with unstructured variance structure, which was adjusted for age, sex, baseline fasting glucose, physical activity, and baseline body weight.

