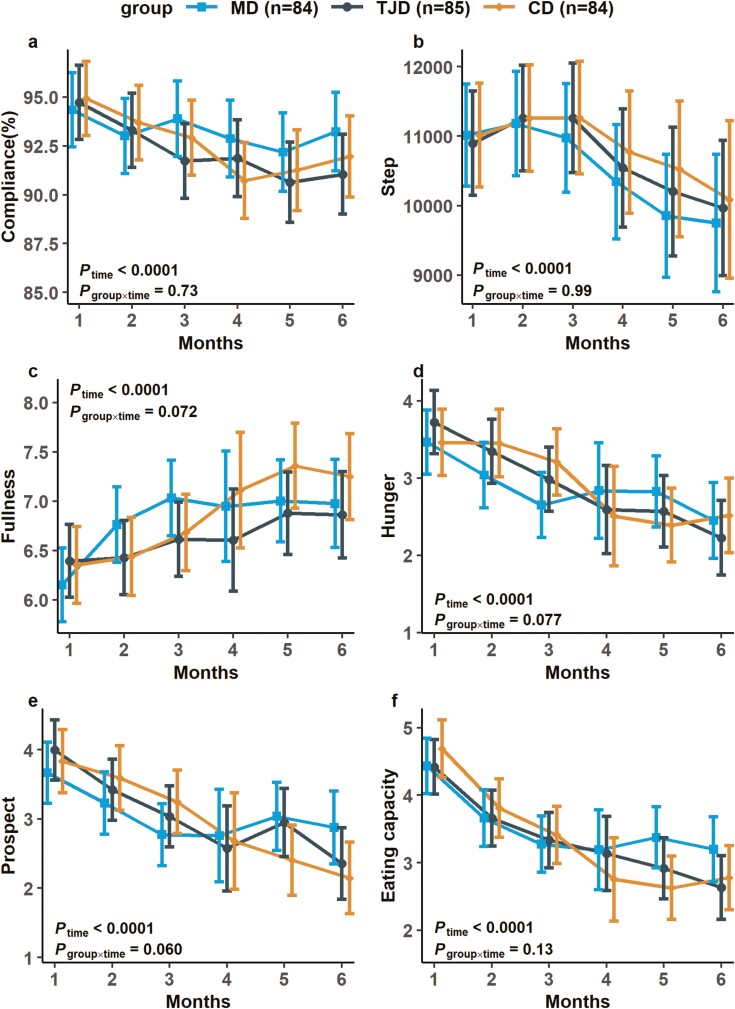
Figure 4.
Compliance, step record and appetitive measurements during intervention. The values are presented as observed means (Mediterranean diet [MD], n = 84; traditional Jiangnan diet [TJD], n = 85; control diet [CD], n = 84). Error bars indicate 95% CI. P group × time on variables were examined by mixed-effects linear models with unstructured variance structure, which adjusted for age, sex, baseline BMI, baseline fasting glucose, physical activity, and baseline values. (A) The rate of compliance. (B) Step record. (C) Fullness. (D) Hunger. (E) Prospective consumption. (F) Eating capacity.

