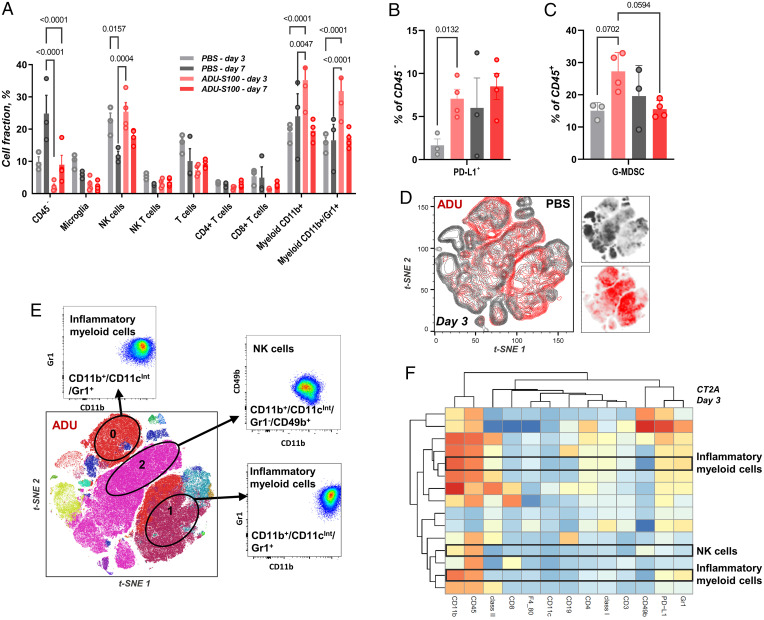
Fig. 4.
Assessment of CT-2A tumor immune infiltrates after STING agonist treatment. (A) BILs profile of CT-2A tumors at days 3 and 7 using a typical gating procedure. Biologically independent animals per group (PBS, n = 3; ADU-S100, n = 4). P values calculated by two-way ANOVA. (B) PD-L1+ percentage of CD45− cells. P value calculated by unpaired t test. (C) MDSC populations within the BILs. P values calculated by one-way ANOVA. (D) 2D t-SNE plots at day 3; treated mice in red and controls in dark gray. (E) t-SNE map for treated mice at day 3 colored by the FlowSOM populations; main up-regulated FlowSOM populations are highlighted. (F) Heatmap and hierarchical clustering of the FlowSOM populations at day 3.

