Fig. 5.
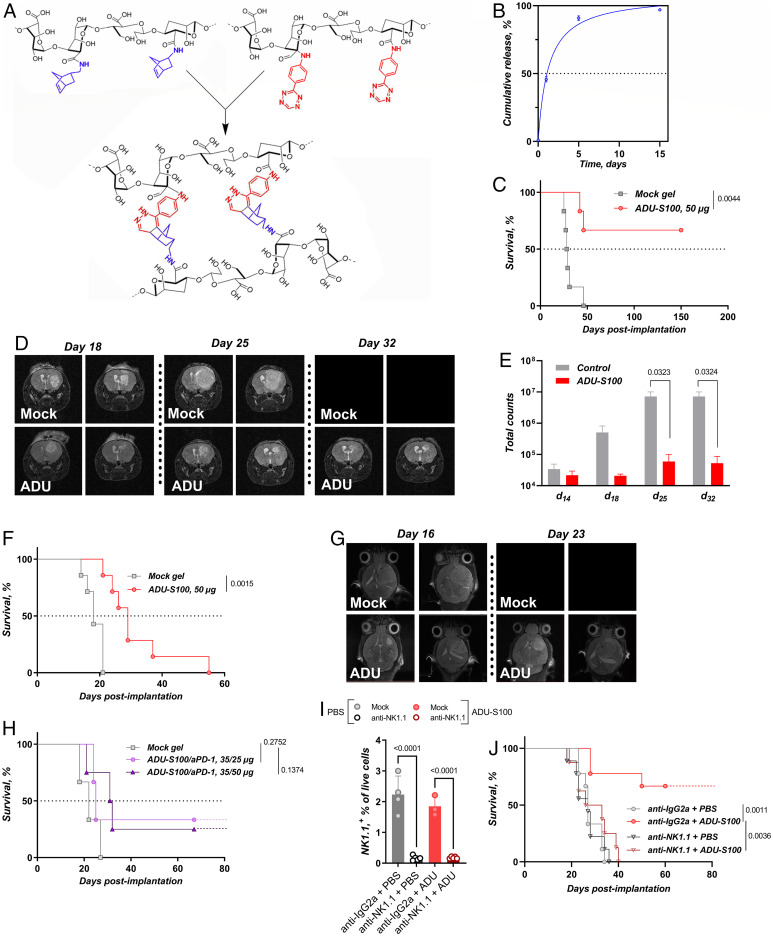
STING agonist treatment of murine GBM in vivo. (A) Biodegradable cross-linked hydrogels used as intracranial implants. (B) In vitro gel release profile for cGAMP. (C) Kaplan–Meier plot for the GL261 ADU-S100 monotherapy study. P value calculated by the Gehan–Breslow–Wilcoxon test. 5 × 10⁴ GL261Fluc cells were implanted at day 0, and intracranial gels were implanted at day 14. Biologically independent animals per group (mock gel, n = 6; ADU-S100 50 µg, n = 6). (D) GL261 in vivo efficacy study showing MRI starting posttreatment day 18. Blank images represent euthanized animals. (E) Bioluminescence IVIS signal from treatment day to end point, GL261FLuc. P values calculated by multiple unpaired t tests. (F) Kaplan–Meier plot for the CT-2A ADU-S100 monotherapy study. P value calculated by the Gehan–Breslow–-Wilcoxon test. 5 × 10⁴ CT-2A cells were implanted at day 0, and intracranial gels were implanted at day 7. Biologically independent animals per group (mock gel, n = 6; ADU-S100 50 µg, n = 7). (G) CT-2A in vivo efficacy study showing representative MRI pictures at days 18 and 23. Blank images represent euthanized animals. (H) Kaplan–Meier plot for the CT-2A ADU-S100/aPD-1 combination study. P value calculated by the Gehan–Breslow–Wilcoxon test. 5 × 10⁴ CT-2A cells were implanted at day 0, and intracranial gels were implanted at day 7. Biologically independent animals per group (mock gel, n = 3; ADU-S100/aPD-1 35/25 µg, n = 3; ADU-S100/aPD-1 35/50 µg, n = 4). (I) Percentage of NK cells as measured in the whole blood of mice 32 h after intraperitoneal administration of the anti-NK1.1 depleting antibody, leading to >98% removal of the targeted immune cells (n = 3–5 mice per group). P values calculated by one-way ANOVA. (J) Kaplan–Meier plot for the GL261 ADU-S100 monotherapy study with and without NK depletion. 5 × 10⁴ GL261Fluc cells were implanted at day 0, and mice were treated intracranially at day 14. The depleting antibody was injected 36 h before STING agonist treatment and biweekly after that. P value calculated by the Gehan–Breslow–Wilcoxon test. Biologically independent animals per group (mock + PBS, n = 8; anti-NK1.1 + PBS, n = 8; mock + ADU-S100 50 µg, n = 9; anti-NK1.1 + ADU-S100 50 µg, n = 8).

