Fig. 3.
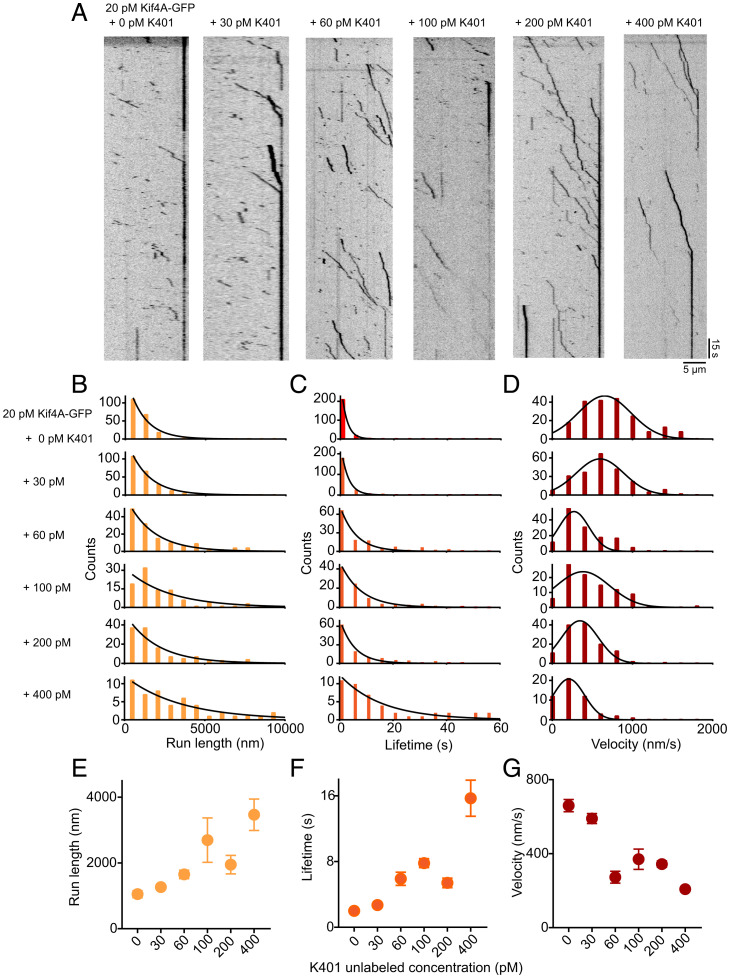
Single-molecule analysis of Kif4A-GFP movement in the presence of K401-unlabeled. (A) Kymographs obtained from time-lapse image sequence of microtubules with Kif4A-GFP (20 pM) in presence of 0, 30, 60, 100, 200, and 400 pM K401-unlabeled. Kymographs are aligned so that the plus ends of microtubules appear on the right. (B–D) Histograms of the run length (B), lifetime (C), and average velocity (D) obtained from time-lapse image sequence of Kif4A-GFP (20 pM) in presence of 0, 30, 60, 100, 200, and 400 pM K401-unlabeled. Run length and lifetime histograms were fitted to an exponential function. The average velocity histogram was fitted to a Gaussian distribution. (E) Average run length versus K401 concentration, obtained from the exponential fit in B: 0 pM (1,050 nm, n = 202), 30 pM (1,264 nm, n = 228), 60 pM (1,650 nm, n = 140), 100 pM (2,694 nm, n = 96), 200 pM (1,949 nm, n = 129), and 400 pM (3,465 nm, n = 51). (F) Average lifetime versus K401 concentration, obtained from the exponential fit in C: 0 pM (1.5 s, n = 202), 30 pM (2.7 s, n = 228), 60 pM (5.9 s, n = 140), 100 pM (7.8 s, n = 96), 200 pM (5.4 s, n = 129), and 400 pM (15.7 s, n = 51). (G) Average velocity versus K401 concentration, obtained from the Gaussian fits in D: 0 pM (660 nm/s, n = 202), 30 pM (590 nm/s, n = 228), 60 pM (273 nm/s, n = 140), 100 pM (370 nm/s, n = 96), 200 pM (343 nm/s, n = 129), and 400 pM (208, n = 51). The error bars represent the SEM.

