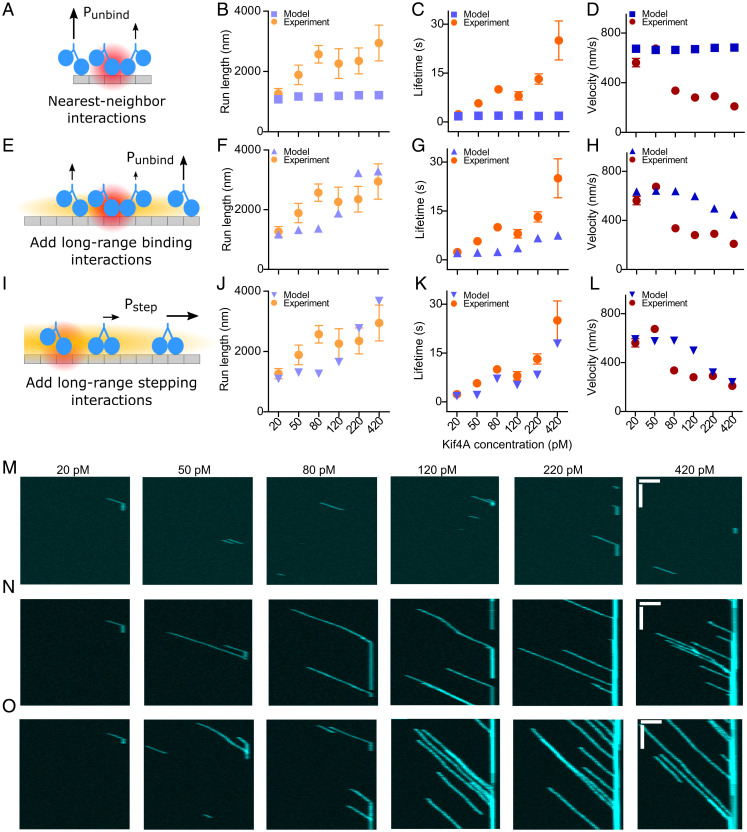
Fig. 5.
A model with long-range interactions that affect both motor binding and stepping best reproduces the experimental results. (A) Schematic of nearest-neighbor interaction. The red cloud shows the range of the interaction (one site), and the length of arrows shows relative event probability. In the model, nearest-neighbor interactions decrease the motor unbinding rate but do not affect binding. (B–D) Motor run length, lifetime, and velocity versus motor concentration for simulation (blue) and experiment (orange, red). The strength of the interaction is 2 , but the simulation results are similar for interaction strength up to 10 kBT (SI Appendix, Fig. S21). (E) Schematic of long-range binding interaction. The orange cloud represents the range of the interaction (not to scale; the range in simulation is ∼1,000 binding sites). This long-range interaction affects motor binding and unbinding and is implemented in addition to the nearest-neighbor interaction. (F–H) Motor run length, lifetime, and velocity versus motor concentration for simulation (blue) and experiment (orange, red). (I) Schematic of long-range stepping interaction. This long-range interaction acts to reduce overall motor velocity and is implemented in addition to both the long-range binding and nearest-neighbor interactions. (J–L) Motor run length, lifetime, and velocity versus motor concentration for simulation (blue) and experiment (orange, red). (M–O) Simulated kymographs with varying motor concentration and 20-pM visible motors for the model with (M) nearest-neighbor interactions only; (N) nearest-neighbor and long-range binding interactions; and (O) nearest-neighbor, long-range binding, and long-range stepping interactions. The plus ends of microtubules appear on the right. (Horizontal and vertical scale bars: 2 µm and 10 s, respectively.).

