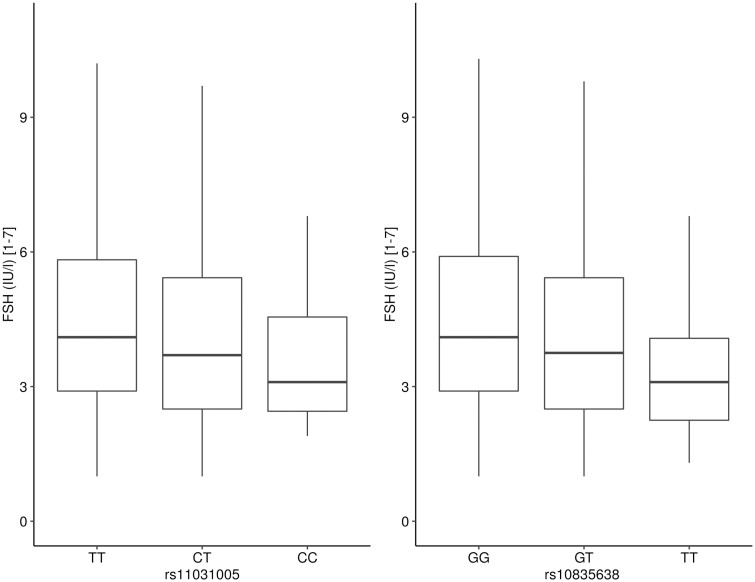
Figure 4.
Association between single-nucleotide variations (SNVs) rs11031005 and rs10835638 and follicle-stimulating hormone (FSH) serum levels using an additive model. Box plot depicting FSH serum levels for genotypes in the validation cohort (n = 1140). Medians are drawn as straight lines. Upper and lower hinges correspond to the 25th and 75th percentiles, respectively. Upper and lower whiskers extend to 1.5 interquartile ranges. Data beyond the end of the whiskers are not shown.

