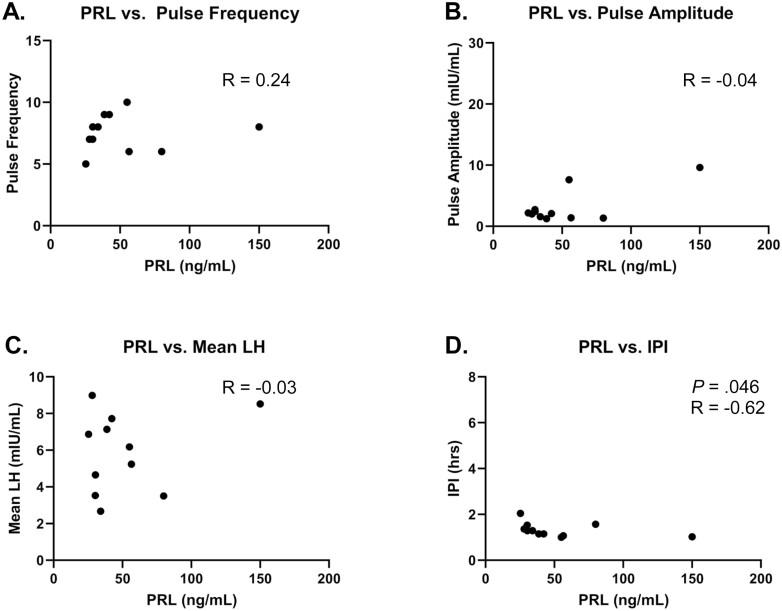
Figure 3.
Relationship between prolactin (PRL) levels of individuals at visit 2 and features of luteinizing hormone (LH) response to kisspeptin at visit 2 (n = 11). PRL level from visit 2 before kisspeptin administration (hour 0-hour 1) is included in this analysis. Pulse frequency, mean LH, and interpulse interval (IPI) were calculated across the time frame of kisspeptin administration (hour 1-hour 11). LH pulse amplitude from response to first kisspeptin bolus is included in this analysis. A, PRL vs pulse frequency; B, PRL vs LH pulse amplitude; C, PRL vs mean LH levels; and D, PRL vs IPI. Statistically significant P and R values are included in the figure.

