

Abstract
Background:
Both chronic and acute heat result in a substantial health burden globally, causing particular concern for at-risk populations, such as older adults. Outdoor temperatures are often assessed as the exposure and are used for heat warning systems despite individuals spending most of their time indoors. Many studies use ecological designs, with death or hospitalizations rates. Individual-level outcomes that are directly related to heat-symptoms should also be considered to refine prevention efforts.
Objectives:
In this longitudinal study, we assessed the association between indoor temperature and proximal symptoms in individuals of age living in non–air-conditioned households in Montérégie, Quebec, during the 2017–2018 summer months.
Methods:
We gathered continuously measured indoor temperature and humidity from HOBO sensors and repeated health-related questionnaires about health-related symptoms administered across three periods of increasing outdoor temperatures, where the reference measurement (T1) occurred during a cool period with a target temperature of 18–22°C and two measurements (T2 and T3) occurred during warmer periods with target temperatures of 28–30°C and 30–33°C, respectively. We used generalized estimating equations with Poisson regression models and estimated risk ratios (RRs) between temperature, humidity, and each heat-related symptom.
Results:
Participants () had an average age of . Higher indoor temperatures were associated with increased risk of dry mouth (T3 ; 95% CI: 1.8, 3.5), fatigue (; 95% CI: 1.8, 3.0), thirst (; 95% CI: 2.5, 4.5), less frequent urination (; 95% CI: 1.8, 7.3), and trouble sleeping (; 95% CI: 1.6, 3.2) compared with T1. We identified a nonlinear relationship with indoor temperatures across most symptoms of interest.
Discussion:
This study identified that increasing indoor temperatures were associated with various health symptoms. By considering the prevalence of these early stage outcomes and indoor temperature exposures, adaptation strategies may be improved to minimize the burden of heat among vulnerable communities. https://doi.org/10.1289/EHP10291
Introduction
Heat waves are one of the most hazardous types of natural disasters, causing a range of health consequences across various populations.1,2 It is particularly important to better understand extreme heat ramifications to develop tailored adaptation strategies in the context of climate change and variability.2–5 Furthermore, global average temperatures are rising and will continue to rise as a result of climate change, contributing to the worsening of chronic heat and, in turn, lead to health consequences.6 Heat exposure is associated with many symptoms and illnesses that include, but are not limited to, discomfort,7,8 heat syncope,9 heat cramps,7,9 heat exhaustion,7,9 heat stroke,7,9–11 and respiratory distress7,10,11 and the aggravation of preexisting conditions, such as asthma10 and diabetes,10 as well as cardiovascular,8 respiratory,10 and cerebrovascular diseases,10 and ultimately leading to premature death,7,9,11 as noted in several studies and reviews.
The vast majority of epidemiological studies studying heat impacts on potential health effects rely on ecological designs, such as time-series or case crossover designs, and aggregated health outcomes, which mostly include either hospitalization or death rates1,12–15; however, certain reviews have emphasized that more immediate outcomes should also be considered to better assess early symptoms on heat physiological pathways that may eventually lead to an emergency department visit or even premature death if no preventive action is adopted.16,17 Physiological pathways by which heat exposure can lead to various organs’ failure and subsequent death have been identified in a review by Mora et al.,17 including ischemia, heat cytotoxicity, inflammatory responses, disseminated intravascular coagulation, and rhabdomyolysis, making it especially critical to better understand the earlier symptoms that occur through these various pathways.17 Some of these more immediate symptoms can include increased body temperature,16,18,19 sleep disturbance and decreased sleep quality,16,18–20 feeling hot,19 thirst,19,20 excessive sweating,20 annoyance or discomfort,18–20 feeling absent-minded,19 headaches,18,19 and fatigue.18–20 Collecting data on such early symptoms and analyzing how they are affected by extreme heat is critical because it is possible to act on these more immediate symptoms to minimize more acute and severe symptoms from heat. By identifying which earlier symptoms are impacted by heat, the thresholds at which heat alert systems are activated may be updated and both health professionals and at-risk populations may be made aware of which symptoms to watch for and what actions they may take to minimize these health burdens. Many immediate symptoms have also yet to be sufficiently explored and assessed, such as disrupted sleep and sleep quality, as well as various mental health symptoms, such as anxiety and depression.21–26 Yet, because such individual-level data are not routinely collected nor available through electronic health records, for example, it becomes necessary to collect these data directly among vulnerable individuals with validated questionnaires administrated by trained public health professionals.
Moreover, outdoor air temperatures are often assessed as the exposure of interest in the epidemiological literature, mostly for data availability reasons, but also because heat warning systems, which allow for communities to prepare and respond to heat wave events, are typically based on outdoor temperature observations.27 However, individuals spend a much larger portion of their time indoors, and, although often moderately correlated with indoor temperatures, outdoor temperatures may differ by many degrees from indoor temperatures.5,16,28–30 For instance, in a study by White-Newsome et al.30 that assessed indoor and outdoor air temperature in the summer of 2009 in Detroit, Michigan, average maximum indoor temperatures were found to be 13.8°C higher than average maximum outdoor temperatures.30 These differences may be larger depending on building, behavioral, and environmental characteristics, including the type of building materials,4,28,30 thermal insulation,5,28,31 urbanicity,5 proximity to green spaces,5 number of occupants,4 air conditioning (AC) availability,4 and living under a building’s roof.31 Furthermore, weather stations that measure outdoor temperature do not take into account the fine-scale spatial variability of micro heat islands, which can lead to substantial exposure misclassification.28,32,33 In this context, considering exposure to indoor temperatures is needed to accurately quantify the impact of heat on various health symptoms.
To address the gaps in the literature regarding the use of indoor air temperature and various heat-related symptoms, this study sought to understand the association between chronic and acute indoor heat and various immediate heat-related health impacts in individuals of age who lived in non–air-conditioned buildings in Montérégie, Quebec, during the 2017–2018 summer months. Older adults were selected as the study population because they are among the most at-risk for heat-related consequences as a result of changes with age in the thermoregulatory system, as well as their increased susceptibility to heat extremes and associated air pollution.2,9,16,31,34–36 We sought to assess a range of immediate physical symptoms, such as cramps, headaches, and dry mouth, and their relationship with increasing indoor heat, which were selected from the literature.16,18–20 We also explored the impact of indoor heat on mental health symptoms, such as anxiety and depression, for which there is some limited literature discussing the relationship between higher temperatures and these mental health consequences.24–26 On the basis of these prior studies, we hypothesized that increasing heat would be associated with an exacerbation of immediate symptoms. Moreover, the heat alert system in Montérégie is triggered during a forecast of 3 consecutive days with an average temperature of 33°C, which is not the threshold where heat-related health effects begin to be felt by residents but, rather, a population threshold that is based on 60% excess deaths.37 By conducting this research, immediate symptoms that are potentially predictive of life-threatening conditions may be identified, the health effects of indoor temperatures can be better characterized, and the identification of more accurate thresholds at which these symptoms occur may be achieved, leading to the improvement and implementation of tailored heat alert systems and adaptation strategies.
Methods
This longitudinal study investigated the association between indoor temperature and immediate heat-related symptoms in older adults in 2017 and 2018. Snowball sampling was used to recruit a sample of 303 participants of age living at home in Montérégie, Canada. Participants received a financial compensation at each interview. An initial interview was conducted with participants to describe the study objectives and the data collection procedure, to ensure the participant was eligible, and to set up an appointment to install a temperature and humidity logger. Individuals with a cognitive impairment who could not provide consent and those who use AC (any type, including central AC, window-mounted AC, or other portable ACs) were excluded from the study. Individuals who were available to complete three telephone interviews, spoke either French or English, and provided informed consent were included in this study. The study protocol was approved by the ethics committees of the Hospital of Charles-Le Moyne.
Data were gathered across three time periods of subsequently increasing outdoor temperatures, where the reference measurement (T1) occurred during a cool temperature period with a target temperature of 18–22°C and two measurements (T2 and T3) occurred during warmer temperature periods with target temperatures of 28–30°C and 30–33°C, respectively, for a period of 3 d. These target temperatures were based on the expected temperature from weather forecasting stations in the days prior to the predicted date. We aimed at capturing different types of days with varying temperature characteristics and a priori defined these categories (except T3, which was based on the Environment Canada threshold to trigger heat alert systems in this region). Data were collected using HOBO UX100-003 temperature and humidity loggers as well as questionnaires administered by telephone regarding health symptoms.
The HOBO temperature and humidity loggers were installed, prior to the three temperature measurement periods (T0), inside the home on a wall unexposed to the sun and in the room that the resident most frequently used. During this T0 interview, we also collected participant sociodemographic and housing characteristics information. Both the temperature and relative humidity were measured and recorded every 10 min across 5 months for the 163 participants followed in 2017 and across 6 months for the 114 participants recruited in 2018. These indoor temperatures were categorized based on the three aforementioned time periods. The humidex, which takes into account both temperature and humidity, was also calculated using the following formula: , where T is the temperature in degrees Celsius and RH is the relative humidity (in percentage). For each period (T1, T2, T3), the average temperature and humidity from measurements taken during the 24 h prior to the telephone interview were calculated for each participant. Three exposures were used: the temperature, relative humidity, and humidex factor. Each participant had three measurements for each of these heat indicators, one for each period.
An observational grid was used to collect participant information, including sociodemographic characteristics and health status, which were collected at time T0. In addition, a health questionnaire was conducted by trained public health professionals by telephone during the three periods. Information about 13 possible immediate effects of heat—anxiety, dry mouth, cramps, depressive symptoms, lightheadedness, fatigue, nausea, headache, loss of consciousness, more frequent thirst (as a proxy for dehydration), less frequent urination, trouble sleeping, and dark urine—were collected. These variables were binary (yes/no), and the respondents were not told that these symptoms were potentially associated with heat.
To compare the probability of reporting each outcome across the different exposure periods, T1, T2, and T3, we used generalized estimating equations (GEEs; given the longitudinal data being assessed) with an exchangeable correlation matrix. Unadjusted and adjusted multivariable Poisson regression models (with robust variance) estimated risk ratios (RRs) and 95% confidence intervals (CIs) for the association between increasing temperature and heat-related symptoms.38 The adjusted models controlled for the following confounders: the study year (2017; 2018), self-reported health status (reported existing health issues; did not report any existing health issues), living alone (dichotomous based on continuous number of individuals living in household), sex (female; male), age (continuous), education (primary school; high school; college/university), and income (insufficient financial resources; sufficient financial resources). A directed acyclic graph was used to ensure that conditioning on these covariates was sufficient to close identified backdoor paths (Figure S1).
Moreover, as we collected indoor temperatures, we explored the nonlinear relationship between maximum temperature, humidex, and reported symptoms of interest. We also used GEE Poisson models that instead included continuous indoor temperature and humidex exposures coupled with natural cubic splines to model nonlinear relationships (final number and location of knots in the final models were based on the Akaike criterion). We estimated (and plotted) for each temperature unit the marginal probability (using the margins package) of observing a given health symptom. Models converged for only eight outcomes, which are reported in Figure 1 and Figure S1 (we did not report estimates for models that did not converge, including five outcomes: anxiety, depressive symptoms, headache, loss of consciousness, and nausea). In a separate analysis, we modeled outdoor temperature exposures categorically in categories T2 and T3, with T1 as the reference category. These categories corresponded to outdoor temperature ranges that determined the data gathering time period, as described above. The 13 aforementioned health symptoms were assessed for this analysis. In all models, we adopted a complete case analysis (the proportion of participants who were excluded for missing information varied between 8.78% and 17.09%; see details in Table 1).
Figure 1.
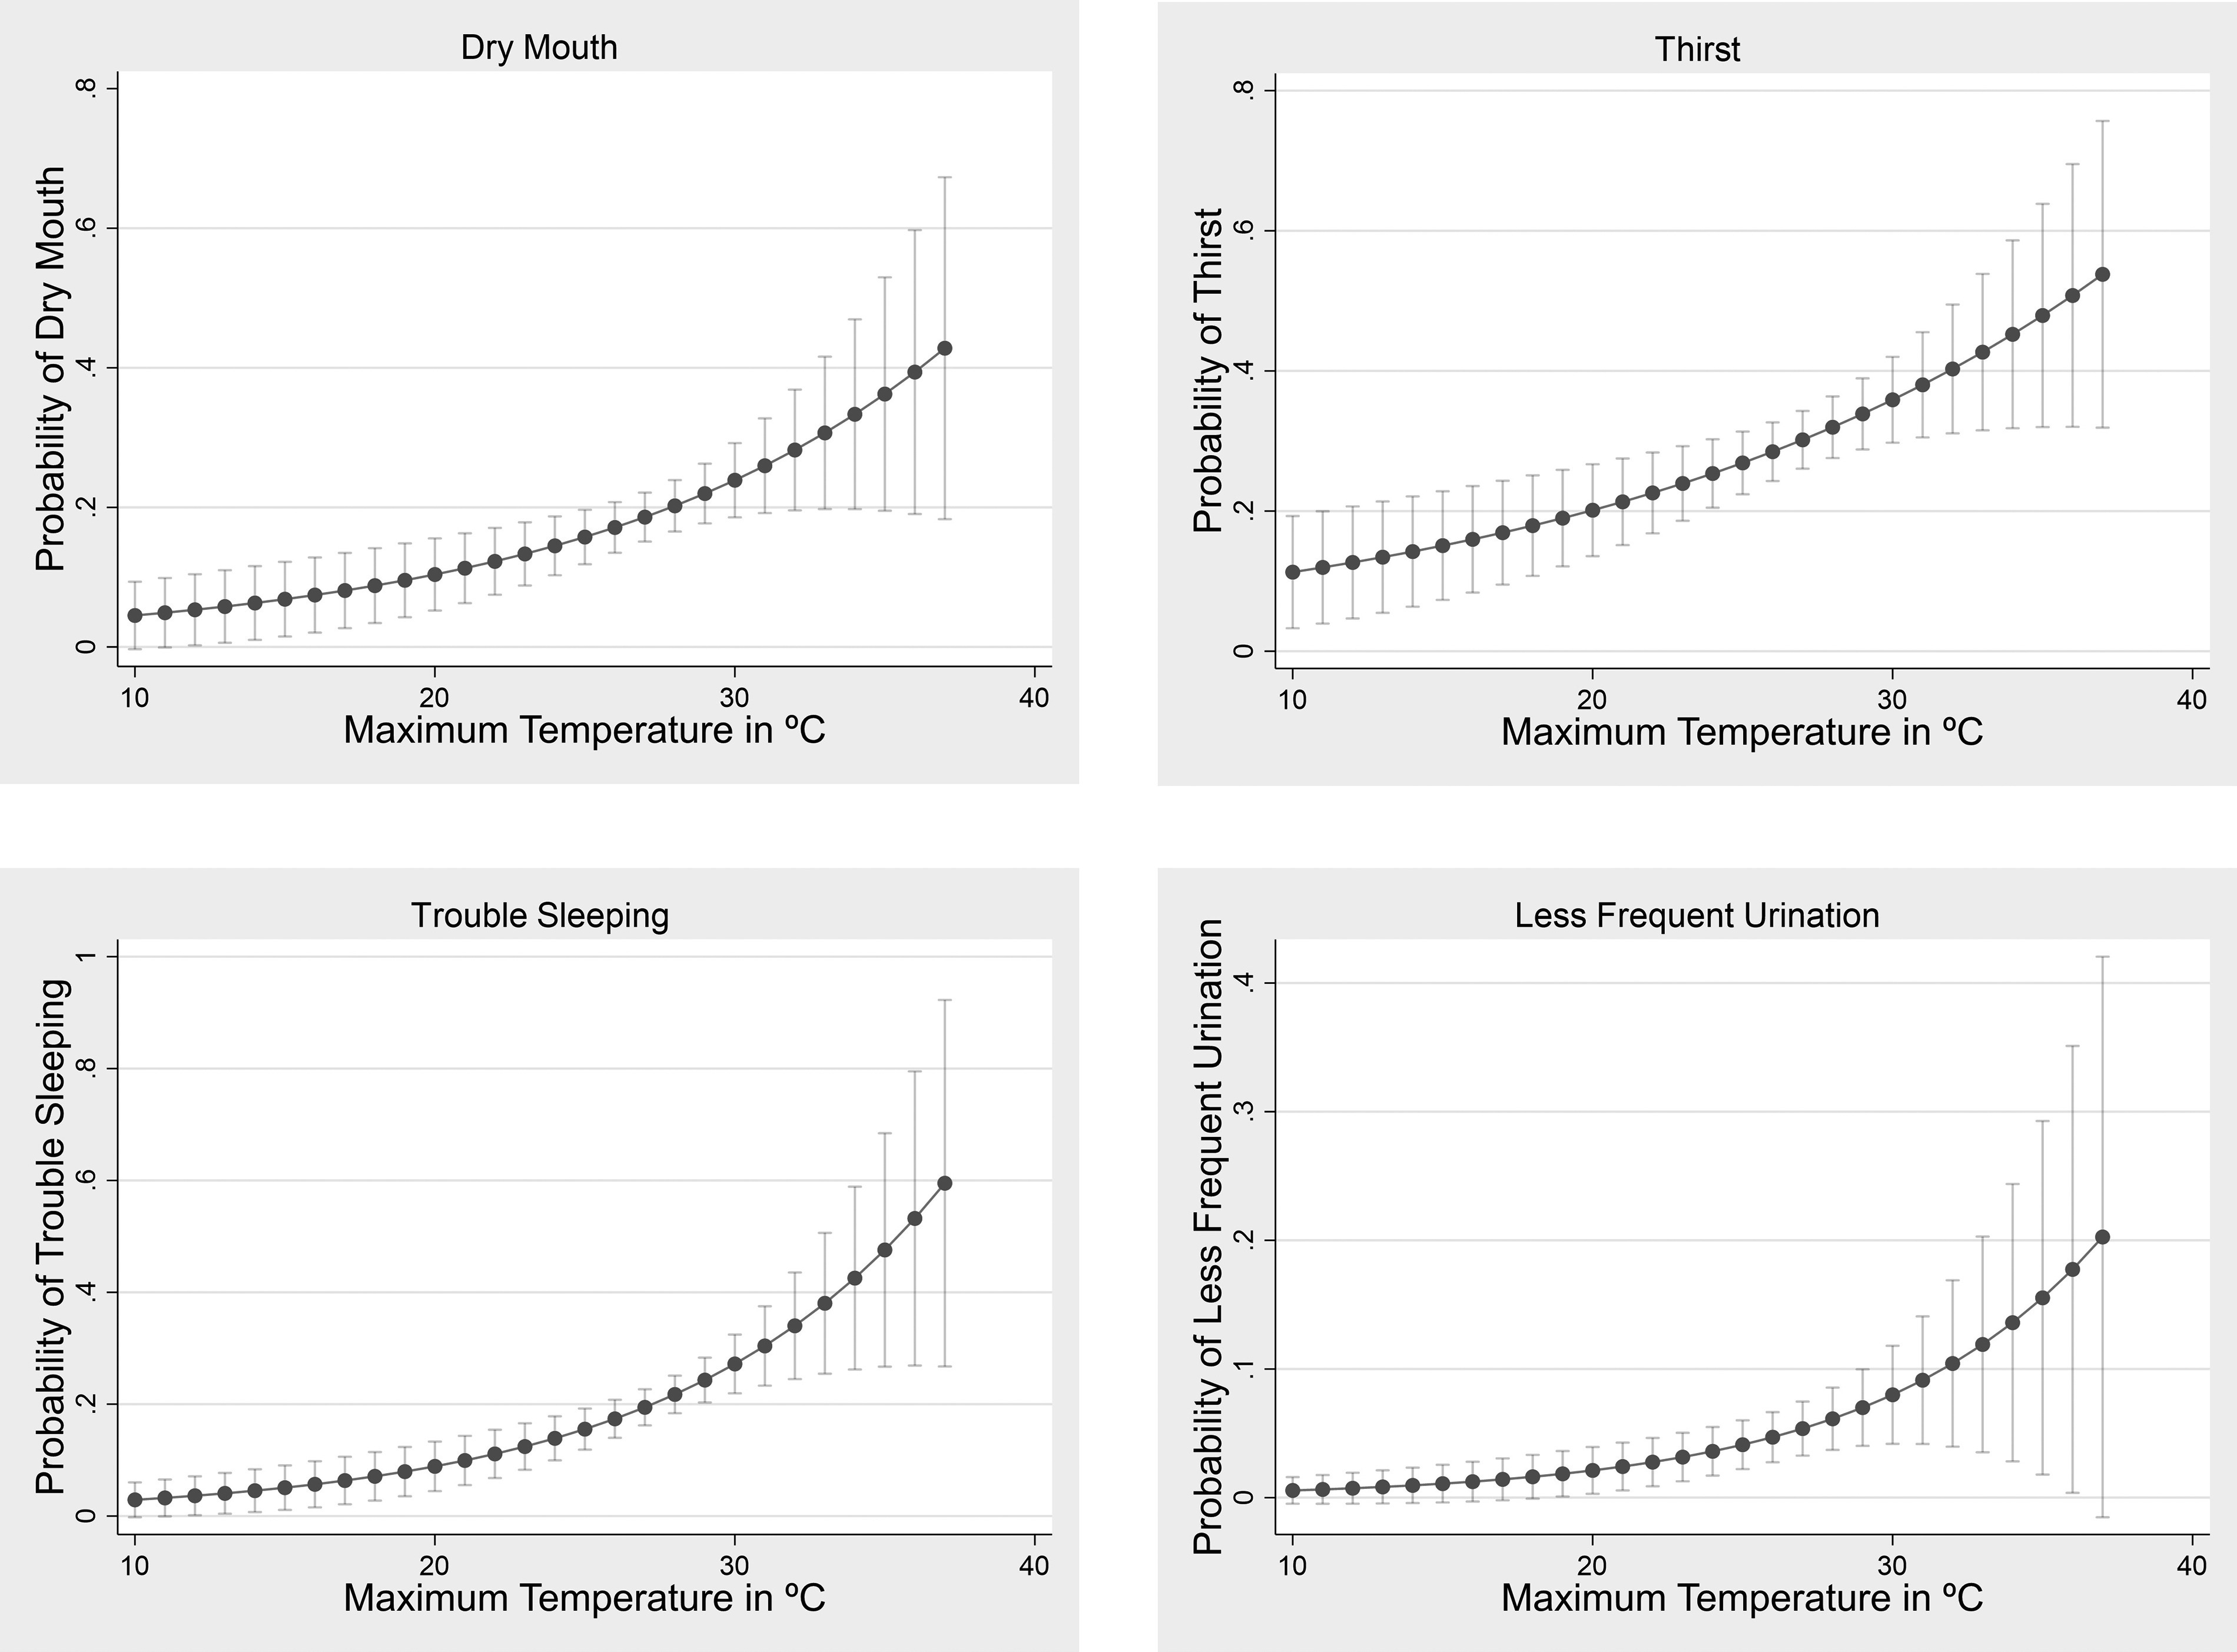
Probability of selected symptoms with increasing indoor maximum temperature in degrees Celsius (°C) in Montérégie, Quebec. The marginal probability estimate is provided as the central point, and the error bars provide the 95% confidence intervals for these probabilities. See Figure S2 for the other symptoms. Numeric data are presented in Table S4. Models did not converge for the following symptoms: anxiety, depressive symptoms, headache, loss of consciousness, and nausea.
Table 1.
Number of reported symptoms (and prevalence) for each exposure period (2017–2018). T1 is defined as the cool temperature period (18–22°C), T2 is the warmer temperature period (28–30°C), and T3 is the warmest temperature period (30–33°C) in Montérégie, Quebec.
| Events [ (%)] | |||
|---|---|---|---|
| Heat-related symptomsa | T1 cool temperature period (18–22°C) | T2 warmer temperature period (28–30°C) | T3 warmesst temperature period (30–33°C) |
| Anxiety | 28 (10.11) | 39 (14.08) | 41 (14.8) |
| Dry mouth | 29 (10.47) | 59 (21.30) | 76 (27.44) |
| Cramps | 49 (17.69) | 63 (22.74) | 72 (25.99) |
| Depressive symptoms | 21 (7.58) | 33 (11.91) | 27 (9.75) |
| Lightheadedness | 30 (10.83) | 32 (11.55) | 44 (15.88) |
| Fatigue | 52 (18.77) | 93 (33.57) | 127 (45.85) |
| Nausea | 12 (4.33) | 15 (5.42) | 30 (10.83) |
| Headache | 35 (12.64) | 37 (13.36) | 43 (15.52) |
| Loss of consciousness | 8 (2.89) | 6 (2.17) | 15 (5.42) |
| Thirst | 41 (14.8) | 82 (29.60) | 148 (53.43) |
| Less frequent urination | 9 (3.25) | 21 (7.58) | 37 (13.36) |
| Trouble sleeping | 36 (13) | 51 (18.41) | 85 (30.69) |
| Dark urine | 20 (7.22) | 44 (15.88) | 38 (13.72) |
Proportion of missing observations for each analyzed outcome: fatigue (9.15%); trouble sleeping (9.27%); headache (9.15%); lightheadedness (8.78%); loss of consciousness (8.90%); nausea (8.78%); dry mouth (10.0%); less frequent urination (10.83%); dark urine (17.09%); cramps (9.51%); anxiety (9.15%); depressive symptoms (8.90%); and thirst (8.78%).
We also collected self-reported information about preexisting health conditions, including diabetes, as well as cardiovascular, respiratory, kidney, or neurological diseases, and cancer. We conducted an additional analysis to explore to what extent such self-reported preexisting health conditions modified the association between heat exposure (using the three categorical exposures) and heat-related symptoms of interest. We aimed at estimating effect modification on the additive scale and calculated relative risks due to interaction (RERI) using the following formula: , where is the RR assessing the risk of the outcome (heat-related symptoms) when x (heat exposure) or y (preexisting conditions) are present (1) or absent (0) in comparison with those for whom both x and y are absent (0).39
Results
A total of 277 participants completed follow-up (91.4% retention rate), in which 163 individuals were followed from June to October in 2017 and 114 were followed from June to November in 2018. The average in our study population was (minimum–maximum: 60–95 y) and most of the participants were women (80.1%) and retired (94%). The majority of our study participants (58.8%) had a high school degree (secondaire) and reported having sufficient financial resources (59.9%). Most of the participants were living alone (80.9%) and reported existing health issues (64.5%) (Table S1). Table 1 includes the number of reported events for each symptom by exposure period (T1, T2, and T3). In T1 (with cool temperatures), the most prevalent outcome was fatigue (18.8%), followed by cramps (17.7%), thirst (14.8%), and trouble sleeping (13%). We observed an increase in the proportion of reported symptoms with increasing temperatures except for anxiety and depressive symptoms.
The results from the models assessing the association between the three temperature periods and health symptoms are depicted in Figure 2 (exact estimates are presented in Table S2). This includes the unadjusted and adjusted models. Overall, results from unadjusted and adjusted models were similar. We found that for all outcomes of interest, the adjusted risk was higher in T3 (30–33°C) relative to T1 (18–22°C), particularly for less frequent urination (; 95% CI: 1.8, 7.3), thirst (; 95% CI: 2.5, 4.5), nausea (; 95% CI: 1.3, 5.1), and dry mouth (; 95% CI: 1.8, 3.5). The RRs can be interpreted as follows: Adjusting for known confounders, the risks of less frequent urination, thirst, nausea, and dry mouth during T3 were 3.7, 3.4, 2.6, and 2.5 times the risk of these symptoms during T1, respectively. Compared with the increased risks identified in T3, an attenuated, positive RR was observed for T2 (28–30°C) in all symptoms except for loss of consciousness, headache, nausea, and lightheadedness. Overall, with the exception of dark urine and depressive symptoms, the risk of the symptoms of interest increased with increasing temperatures, where the RRs for T3 were greater than the RRs for T2 relative to the reference cool period T1, indicating an exposure–response relationship between higher temperatures and the increased risk of these symptoms.
Figure 2.

Unadjusted (A) and adjusted (B) multivariable Poisson regression models (with robust variance) assessing the relationship between a range of heat-related health conditions and temperature periods T2 (28–30°C) and T3 (30–33°C) relative to T1 (18–22°C) for participants in Montérégie, Quebec. Risk ratios (RRs) are depicted as points, and 95% confidence intervals are shown as lines on either side of the RR points. Numeric data are presented in Table S2, and values from which these RRs were derived from are provided in Table 1. The adjusted models were adjusted for the following confounders: study year, self-reported health status, living alone, sex, age, education, and income.
We then analyzed the exposure–response between maximum temperature and each symptom of interest. We identified an increase in the risk of reporting symptoms with increasing indoor maximum temperatures for all outcomes except depressive symptoms, anxiety, nausea, and headache. We found very similar patterns when using indoor maximum humidex. In Figure 1, we present such relationships for four symptoms (dry mouth, thirst, trouble sleeping, and less frequent urination) in which we can also observe a nonlinear relationship with thresholds varying across symptoms (Figure S2 in the supplemental material provides these relationships for the other symptoms, and numeric data are presented in Table S4). For example, for trouble sleeping, we can observe that the probability of reporting such symptom increased more rapidly (when compared with the lowest temperature) after 20°C (daily average), whereas such a pattern occurred at higher temperatures for dry mouth or less frequent urination, for example. We also conducted an additional analysis to explore whether self-reported preexisting health conditions modified the association between heat exposure and heat-related symptoms. Overall, we did not find strong evidence (Table S3) that preexisting health conditions modified the effect of heat exposure on most studied symptoms.
Discussion
In this study, we identified that higher indoor temperatures were associated with the increased risk of immediate symptoms, such as dry mouth, fatigue, thirst, less frequent urination, and trouble sleeping. Apart from dark urine and depressive symptoms, we found a nonlinear, exposure–response relationship with identified thresholds varying across symptoms of interest. Mental health-related symptoms, such as anxiety and depression did not follow this association of increased indoor temperatures leading to increased symptoms. This could be explained by at least two factors. First, it is possible that such mental health-related symptoms may appear at higher temperatures than captured in this study. Second, it is possible that anxiety and depression as measured may not fully capture the potential impacts of extreme heat on mental health. Furthermore, other external factors, such as current events, personal experiences, and seasonality, may be exacerbating these symptoms more than high temperatures. In addition, dark urine did not align with this trend either, and we hypothesize that perhaps participants may have been more aware of acute heat events and may have taken protective measures, such as, but not limited to, hydrating, wearing light clothing, and opening windows or using fans during T3 more so than T2.
Currently in the extreme heat impacts literature, few studies have focused on indoor temperature rather than outdoor temperature as the exposure of interest,40–42 and fewer have assessed immediate, less acute heat-related symptoms rather than hospitalization or death as the outcome of interest.43 To our knowledge, few studies have simultaneously assessed both indoor temperature as the exposure and more immediate symptoms as the outcome.19,20,44–47 For instance, Dapi et al.19 specifically assessed 5-d exposure to indoor heat in March on symptoms of fatigue, headache, feeling sick, thirst, vertigo, fever, nausea, feeling hot, and school performance changes in school children living in two Cameroon cities. Higher indoor temperatures were shown to be associated with headache, fatigue, and feeling hot.19 In contrast, Van Loenhout et al.20 focused on indoor temperature exposure from April to August on symptoms such as sleep disturbance and issues with concentration, fatigue, headache, breathing discomfort, thirst, and excessive sweating, in older individuals living in two cities in the Netherlands. Three weeks of predicted maximum temperatures relative to one colder reference week in early May were selected to assess health conditions in the participants.20 The most prevalent symptoms, including thirst, sleep disturbance, and excessive sweating, and increased indoor temperatures were associated with increased sleep disturbance.20 Other studies and reviews additionally focused on cognitive function and performance,44,46 sick building syndrome symptoms,45 and sleep quality and heat illness warning signs48 related to indoor temperatures. Thus, although some overlap exists between these studies and our study in terms of some of the selected immediate heat-related symptoms, the assessed season, and the population of interest, our longitudinal study was the first study to investigate the association between indoor temperatures and such a range of health conditions across multiple summer seasons in an older population living without AC.
Our study underscores the value of focusing on the indoor temperature effects of immediate heat-related health symptoms. Most epidemiological studies use monitoring stations that measure outdoor temperatures and which may not represent the heat exposure that individuals are exposed to. This study emphasizes the need for indoor temperature monitoring and additional assessments of the discrepancies between indoor and outdoor temperatures.16,49 Preparedness and adaptation strategies may be improved as a result, particularly regarding longer heat action periods for heat alert systems given that indoor temperatures have been shown to remain high even when the extreme heat event has ended.48 An improved understanding of the immediate symptoms resulting from increasing heat would allow for more acute health impacts to be prevented through the 27 various physiological pathways that exist by which heat exposure can cause organ failure and death.17 By identifying and preventing these early symptoms, more acute conditions that lead to emergency department visits or death may be reduced. These symptoms may be reduced through the modification of heat management strategies (e.g., adjusting the thresholds that activate heat alert systems to consider variability in indoor exposures among vulnerable communities), social adaptations (e.g., adequate social support), and community outreach programs to ensure that heat-related health risks are minimized and individual behaviors (e.g., opening windows, wearing cooler and lighter clothing, using shade and closing blinds, applying water on the skin or using iced towels, and staying hydrated).50,51 Moreover, at-risk populations and health care professionals may be informed about these early heat-related symptoms that may be indicative of more acute consequences. These strategies should be pursued along with the use of AC, which can be a maladaptation unless implemented with energy efficiency and building weatherization to limit further greenhouse gas emissions. The adoption of these strategies relies on multilevel policy and cross-sectoral collaboration, including urban planning, emergency management and response, educational and public health services, among others.
There are some limitations that should be noted in this study. The generalizability of this study may be limited to older populations living in Quebec without AC. Moreover, given that this study focused on an older population, the results from these individuals may not be representative of other at-risk populations or the general population, who may not be as vulnerable to heat exposure or may have health consequences at varying temperature thresholds.52,53 Population level estimates (for Quebec as our target population) regarding the symptoms we studied are not available, preventing us from calculating risks (or an attributable number of cases). It should also be mentioned that certain factors, such as general health and fitness, that have been identified in studies and reviews may mediate the response of older adults having a diminished ability to lose heat, making these characteristics additionally important to emphasize.54–56 Participants were also predominantly women in this study (80%), and previous studies have identified possible but varied conclusions regarding sex differences in thermoregulation.57–59 Furthermore, heat-related health conditions and AC access vary by location as a result of differences in regional climates and implemented heat adaptation strategies, therefore limiting the generalizability of our findings to older populations living in Quebec.30,41,52 In a study by Bélanger et al.,58 the estimated prevalence of AC was 53.9% (95% CI: 51.6%, 56.1%) in Longueuil (main city in Montérégie), Montreal, or Laval, which was higher than in cooler cities, such as Sherbrooke, for example, with an estimated AC prevalence of 49.4% (95% CI: 45.8%, 53.0%). Moreover, we measured only indoor temperatures, specifically only in the room that was most used by the participant, assuming participants stayed at home during the study period. Yet, participants may have spent some time in other parts of their household as well as outdoors and had differential mobility patterns during both heat and control periods. Given these possible differential mobility patterns, different temperature exposure patterns throughout the day may have occurred, which could contribute to exposure misclassification. Mobility and access to the outdoors may also influence heat susceptibility given that they are critical for physical activity and socialization and, in turn, may improve physical and mental health, which is especially vital in older populations.60–62 This emphasized the importance of measuring and assessing the role of dynamic exposure in future work. In this study, the three interviews were conducted by trained public health professionals during the control period (T1) and the exposed periods (T2 and T3). Thus, we can be certain that during these three different temperature periods, the participants were present at their household and not outdoors. In addition, the heat-related health symptoms were not objectively measured in this study, meaning that these self-reported symptoms could have led to potential bias. It is possible that participants may have underreported or overreported specific symptoms during the three interviews. Future studies may wish to use more objective symptom measurements or validated scales to measure health outcomes that are not prone to self-report bias. Last, three time points were assessed, meaning that a heat wave event could have been missed, and the T3 time point could have been mild in comparison. However, this study design was used because it would not have been logistically feasible to have health professionals collecting data more than three times per summer for each participant. Despite this limitation, we identified an exposure–response relationship between increasing indoor temperatures and increases in many immediate symptoms, indicating that the effects were larger at T3 than at T2. These limitations suggest future research opportunities, such as the inclusion of mobility data, the assessment of indoor temperature and immediate symptoms in other at-risk populations or regions, and the measurement of these immediate heat-related health symptoms with objective metrics.
Conclusion
In assessing the association between indoor temperatures and early symptoms, we identified an exposure–response relationship between increasing temperatures and proximal heat-related health symptoms, such as dry mouth, fatigue, thirst, less frequent urination, and trouble sleeping in older adults. As a result, it appears that increasing indoor temperatures were an etiologic factor in the development of many of these proximal symptoms. As climate change worsens and the urban heat island effect becomes exacerbated, it is increasingly critical to better understand the influence of indoor temperature on a range of health impacts in vulnerable populations to subsequently identify and develop improved adaptation strategies. By doing so, these adaptation strategies may be improved to minimize the burden of heat among vulnerable communities.
Supplementary Material
Acknowledgments
This research was supported by the Fonds vert funding through the Quebec Climate Change 2013–2020 Action Plan.
References
- 1.Cheng J, Xu Z, Bambrick H, Su H, Tong S, Hu W. 2018. Heatwave and elderly mortality: an evaluation of death burden and health costs considering short-term mortality displacement. Environ Int 115:334–342, PMID: , 10.1016/j.envint.2018.03.041. [DOI] [PubMed] [Google Scholar]
- 2.Gronlund CJ, Zanobetti A, Schwartz JD, Wellenius GA, O’Neill MS. 2014. Heat, heat waves, and hospital admissions among the elderly in the United States, 1992–2006. Environ Health Perspect 122(11):1187–1192, PMID: , 10.1289/ehp.1206132. [DOI] [PMC free article] [PubMed] [Google Scholar]
- 3.Pachauri RK, Reisinger A. 2007. Climate Change 2007: Synthesis Report. Contribution of Working Groups I, II and III to the Fourth Assessment Report of the Intergovernmental Panel on Climate Change. Geneva, Switzerland: Intergovernmental Panel on Climate Change. [Google Scholar]
- 4.Aguilera JJ, Andersen RK, Toftum J. 2019. Prediction of indoor air temperature using weather data and simple building descriptors. Int J Environ Res Public Health 16(22):4349, PMID: , 10.3390/ijerph16224349. [DOI] [PMC free article] [PubMed] [Google Scholar]
- 5.Franck U, Krüger M, Schwarz N, Grossmann K, Röder S, Schlink U. 2013. Heat stress in urban areas: indoor and outdoor temperatures in different urban structure types and subjectively reported well-being during a heat wave in the city of Leipzig. Meteorol Zeitschrift 22(2):167–177, 10.1127/0941-2948/2013/0384. [DOI] [Google Scholar]
- 6.Intergovernmental Panel on Climate Change. 2007. Summary for policymakers. In: Climate Change 2007: The Physical Science Basis. Contribution of Working Group I to the Fourth Assessment. Report of the Intergovernmental Panel on Climate Change. Solomon S, Qin D, Manning M, Chen Z, Marquis M, Averyt KB, et al., eds. New York, NY: Cambridge University Press, 1–18. [Google Scholar]
- 7.van der Hoeven F, Wandl A. 2015. Amsterwarm: mapping the landuse, health and energy-efficiency implications of the Amsterdam urban heat island. Build Serv Eng Res Technol 36(1):67–88, 10.1177/0143624414541451. [DOI] [Google Scholar]
- 8.Steeneveld GJ, Koopmans S, Heusinkveld BG, Theeuwes NE. 2014. Refreshing the role of open water surfaces on mitigating the maximum urban heat island effect. Landsc Urban Plan 121:92–96, 10.1016/j.landurbplan.2013.09.001. [DOI] [Google Scholar]
- 9.Kovats RS, Hajat S. 2008. Heat stress and public health: a critical review. Annu Rev Public Health 29:42–55, PMID: , 10.1146/annurev.publhealth.29.020907.090843. [DOI] [PubMed] [Google Scholar]
- 10.Shahmohamadi P, Che-Ani AI, Etessam I, Maulud KNA, Tawil NM. 2011. Healthy environment: the need to mitigate urban heat island effects on human health. Procedia Eng 20:61–70, 10.1016/j.proeng.2011.11.139. [DOI] [Google Scholar]
- 11.Hajat S, Kosatky T. 2010. Heat-related mortality: a review and exploration of heterogeneity. J Epidemiol Community Health 64(9):753–760, PMID: , 10.1136/jech.2009.087999. [DOI] [PubMed] [Google Scholar]
- 12.Knowlton K, Rotkin-Ellman M, King G, Margolis HG, Smith D, Soloman G, et al. 2009. The 2006 California heat wave: impacts on hospitalizations and emergency department visits. Environ Health Perspect 117(1):61–67, PMID: , 10.1289/ehp.11594. [DOI] [PMC free article] [PubMed] [Google Scholar]
- 13.Liss A, Wu R, Chui KKH, Naumova EN. 2017. Heat-related hospitalizations in older adults: an amplified effect of the first seasonal heatwave. Sci Rep 7:39581, PMID: , 10.1038/srep39581. [DOI] [PMC free article] [PubMed] [Google Scholar]
- 14.Anderson GB, Dominici F, Wang Y, McCormack MC, Bell ML, Peng RD. 2013. Heat-related emergency hospitalizations for respiratory diseases in the Medicare population. Am J Respir Crit Care Med 187(10):1098–1103, PMID: , 10.1164/rccm.201211-1969OC. [DOI] [PMC free article] [PubMed] [Google Scholar]
- 15.Michelozzi P, Accetta G, De Sario M, D’Ippoliti D, Marino C, Baccini M, et al. 2009. High temperature and hospitalizations for cardiovascular and respiratory causes in 12 European cities. Am J Respir Crit Care Med 179(5):383–389, PMID: , 10.1164/rccm.200802-217OC. [DOI] [PubMed] [Google Scholar]
- 16.Head K, Clarke M, Bailey M, Livinski A, Ludolph R, Singh A. 2018. Web Annex D. Report of the systematic review on the effect of indoor heat on health. In: WHO Housing and Health Guidelines. WHO/CED/PHE/18.05. Geneva, Switzerland: World Health Organization. [Google Scholar]
- 17.Mora C, Counsell CWW, Bielecki CR, Louis LV. 2017. Twenty-seven ways a heat wave can kill you: deadly heat in the era of climate change. Circ Cardiovasc Qual Outcomes 10(11):e004233, PMID: , 10.1161/CIRCOUTCOMES.117.004233. [DOI] [PubMed] [Google Scholar]
- 18.Kim YM, Kim S, Cheong HK, Ahn B, Choi K. 2012. Effects of heat wave on body temperature and blood pressure in the poor and elderly. Environ Health Toxicol 27:e2012013, PMID: , 10.5620/eht.2012.27.e2012013. [DOI] [PMC free article] [PubMed] [Google Scholar]
- 19.Dapi LN, Rocklöv J, Nguefack-Tsague G, Tetanye E, Kjellstrom T. 2010. Heat impact on schoolchildren in Cameroon, Africa: potential health threat from climate change. Glob Health Action 3(1):5610, PMID: , 10.3402/gha.v3i0.5610. [DOI] [PMC free article] [PubMed] [Google Scholar]
- 20.van Loenhout JAF, le Grand A, Duijm F, Greven F, Vink NM, Hoek G, et al. 2016. The effect of high indoor temperatures on self-perceived health of elderly persons. Environ Res 146:27–34, PMID: , 10.1016/j.envres.2015.12.012. [DOI] [PubMed] [Google Scholar]
- 21.Williams AA, Spengler JD, Catalano P, Allen JG, Cedeno-Laurent JG. 2019. Building vulnerability in a changing climate: indoor temperature exposures and health outcomes in older adults living in public housing during an extreme heat event in Cambridge, MA. Int J Environ Res Public Health 16(13):2373, PMID: , 10.3390/ijerph16132373. [DOI] [PMC free article] [PubMed] [Google Scholar]
- 22.Jackson CL, Gaston SA. 2019. Chapter 8—The impact of environmental exposures on sleep. In: Sleep and Health. Grandner MA, Tan M, eds. London, England: Academic Press, 85–103. [Google Scholar]
- 23.Xiong J, Lan L, Lian Z, De dear R. 2020. Associations of bedroom temperature and ventilation with sleep quality. Sci Technol Built Environ 26(9):1274–1284, 10.1080/23744731.2020.1756664. [DOI] [Google Scholar]
- 24.Hansen A, Bi P, Nitschke M, Ryan P, Pisaniello D, Tucker G. 2008. The effect of heat waves on mental health in a temperate Australian city. Environ Health Perspect 116(10):1369–1375, PMID: , 10.1289/ehp.11339. [DOI] [PMC free article] [PubMed] [Google Scholar]
- 25.Berry HL, Bowen K, Kjellstrom T. 2010. Climate change and mental health: a causal pathways framework. Int J Public Health 55(2):123–132, PMID: , 10.1007/s00038-009-0112-0. [DOI] [PubMed] [Google Scholar]
- 26.Thompson R, Hornigold R, Page L, Waite T. 2018. Associations between high ambient temperatures and heat waves with mental health outcomes: a systematic review. Public Health 161:171–191, PMID: , 10.1016/j.puhe.2018.06.008. [DOI] [PubMed] [Google Scholar]
- 27.Ebi KL, Hess JJ, Watkiss P. 2017. Chapter 8—Health risks and costs of climate variability and change. In: Injury Prevention and Environmental Health. Mock CN, Nugent R, Kobusingy O, Smith KR, eds. 3rd ed. Disease Control Priorities, Vol. 7. Washington, DC: International Bank for Reconstruction and Development/World Bank, 153–170. [PubMed] [Google Scholar]
- 28.Kuras ER, Richardson MB, Calkins MM, Ebi KL, Hess JJ, Kintziger KW, et al. 2017. Opportunities and challenges for personal heat exposure research. Environ Health Perspect 125(8):085001, PMID: , 10.1289/EHP556. [DOI] [PMC free article] [PubMed] [Google Scholar]
- 29.Nguyen MT, Salvesen D. 2014. Disaster recovery among multiethnic immigrants: a case study of southeast Asians in Bayou La Batre (AL) after Hurricane Katrina. J Am Plann Assoc 80(4):385–396, 10.1080/01944363.2014.986497. [DOI] [Google Scholar]
- 30.White-Newsome JL, Sánchez BN, Jolliet O, Zhang Z, Parker EA, Dvonch JT, et al. 2012. Climate change and health: indoor heat exposure in vulnerable populations. Environ Res 112:20–27, PMID: , 10.1016/j.envres.2011.10.008. [DOI] [PMC free article] [PubMed] [Google Scholar]
- 31.Vandentorren S, Bretin P, Zeghnoun A, Mandereau-Bruno L, Crosier A, Cochet C, et al. 2006. August 2003 heat wave in France: risk factors for death of elderly people living at home. Eur J Public Health 16(6):583–591, PMID: , 10.1093/eurpub/ckl063. [DOI] [PubMed] [Google Scholar]
- 32.Waugh DW, He Z, Zaitchik B, Peng RD, Diette GB, Hansel NN, et al. 2021. Indoor heat exposure in Baltimore: does outdoor temperature matter? Int J Biometeorol 65(4):479–488, PMID: , 10.1007/s00484-020-02036-2. [DOI] [PubMed] [Google Scholar]
- 33.Tamerius JD, Perzanowski MS, Acosta LM, Jacobson JS, Goldstein IF, Quinn JW, et al. 2013. Socioeconomic and outdoor meteorological determinants of indoor temperature and humidity in New York City dwellings. Weather Clim Soc 5(2):168–179, PMID: , 10.1175/WCAS-D-12-00030.1. [DOI] [PMC free article] [PubMed] [Google Scholar]
- 34.Klinenberg E. 2001. Dying alone: the social production of urban isolation. Ethnography 2(4):501–531, 10.1177/14661380122231019. [DOI] [Google Scholar]
- 35.USGCRP. 2016. The Impacts of Climate Change on Human Health in the United States: A Scientific Assessment, 10.7930/J0R49NQX. [DOI]
- 36.Balbus JM, Malina C. 2009. Identifying vulnerable subpopulations for climate change health effects in the United States. J Occup Environ Med, PMID: , 10.1097/JOM.0b013e318193e12e. [DOI] [PubMed] [Google Scholar]
- 37.Tardif I, Allaire M. 2015. Plan Régional d’intervention Spécifique Chaleur Extrême (PRIS-CE).
- 38.Zou G. 2004. A modified Poisson regression approach to prospective studies with binary data. Am J Epidemiol 159(7):702–706, PMID: , 10.1093/aje/kwh090. [DOI] [PubMed] [Google Scholar]
- 39.Correia K, Williams PL. 2018. Estimating the relative excess risk due to interaction in Clustered-Data settings. Am J Epidemiol 187(11):2470–2480, PMID: , 10.1093/aje/kwy154. [DOI] [PMC free article] [PubMed] [Google Scholar]
- 40.Vardoulakis S, Dimitroulopoulou C, Thornes J, Lai K-M, Taylor J, Myers I, et al. 2015. Impact of climate change on the domestic indoor environment and associated health risks in the UK. Environ Int 85:299–313, PMID: , 10.1016/j.envint.2015.09.010. [DOI] [PubMed] [Google Scholar]
- 41.Jung C-C, Hsia Y-F, Hsu N-Y, Wang Y-C, Su H-J. 2020. Cumulative effect of indoor temperature on cardiovascular disease–related emergency department visits among older adults in Taiwan. Sci Total Environ 731:138958, PMID: , 10.1016/j.scitotenv.2020.138958. [DOI] [PubMed] [Google Scholar]
- 42.Thai PK, Cândido C, Asumadu-Sakyi A, Barnett A, Morawska L. 2019. Variation of indoor minimum mortality temperature in different cities: evidence of local adaptations. Environ Pollut 246:745–752, PMID: , 10.1016/j.envpol.2018.12.061. [DOI] [PubMed] [Google Scholar]
- 43.Fujii H, Fukuda S, Narumi D, Ihara T, Watanabe Y. 2015. Fatigue and sleep under large summer temperature differences. Environ Res 138:17–21, PMID: , 10.1016/j.envres.2015.02.006. [DOI] [PubMed] [Google Scholar]
- 44.Laurent JGC, Williams A, Oulhote Y, Zanobetti A, Allen JG, Spengler JD. 2018. Reduced cognitive function during a heat wave among residents of non-air-conditioned buildings: an observational study of young adults in the summer of 2016. PLoS Med 15(7):e1002605, PMID: , 10.1371/journal.pmed.1002605. [DOI] [PMC free article] [PubMed] [Google Scholar]
- 45.Sun Y, Hou J, Cheng R, Sheng Y, Zhang X, Sundell J. 2019. Indoor air quality, ventilation and their associations with sick building syndrome in Chinese homes. Energy Build 197:112–119, 10.1016/j.enbuild.2019.05.046. [DOI] [Google Scholar]
- 46.Zhang F, de Dear R, Hancock P. 2019. Effects of moderate thermal environments on cognitive performance: a multidisciplinary review. Appl Energy 236:760–777, 10.1016/j.apenergy.2018.12.005. [DOI] [Google Scholar]
- 47.Quinn A, Shaman J. 2017. Health symptoms in relation to temperature, humidity, and self-reported perceptions of climate in New York city residential environments. Int J Biometeorol 61(7):1209–1220, PMID: , 10.1007/s00484-016-1299-4. [DOI] [PMC free article] [PubMed] [Google Scholar]
- 48.Quinn A, Kinney P, Shaman J. 2017. Predictors of summertime heat index levels in New York city apartments. Indoor Air 27(4):840–851, PMID: , 10.1111/ina.12367. [DOI] [PMC free article] [PubMed] [Google Scholar]
- 49.Lee K, Lee D. 2015. The relationship between indoor and outdoor temperature in two types of residence. Energy Procedia 78:2851–2856, PMID: , 10.1016/j.egypro.2015.11.647.32443548 [DOI] [Google Scholar]
- 50.Sampson NR, Gronlund CJ, Buxton MA, Catalano L, White-Newsome JL, Conlon KC, et al. 2013. Staying cool in a changing climate: reaching vulnerable populations during heat events. Glob Environ Change 23(2):475–484, PMID: , 10.1016/j.gloenvcha.2012.12.011. [DOI] [PMC free article] [PubMed] [Google Scholar]
- 51.Jay O, Capon A, Berry P, Broderick C, de Dear R, Havenith G, et al. 2021. Reducing the health effects of hot weather and heat extremes: from personal cooling strategies to green cities. Lancet 398(10301):709–724, PMID: , 10.1016/S0140-6736(21)01209-5. [DOI] [PubMed] [Google Scholar]
- 52.Kenny GP, Flouris AD, Yagouti A, Notley SR. 2019. Towards establishing evidence-based guidelines on maximum indoor temperatures during hot weather in temperate continental climates. Temperature (Austin) 6(1):11–36, PMID: , 10.1080/23328940.2018.1456257. [DOI] [PMC free article] [PubMed] [Google Scholar]
- 53.Chiang C-M, Lai C-M. 2002. A study on the comprehensive indicator of indoor environment assessment for occupants’ health in Taiwan. Build Environ 37(4):387–392, 10.1016/S0360-1323(01)00034-8. [DOI] [Google Scholar]
- 54.Meade RD, Akerman AP, Notley SR, McGinn R, Poirier P, Gosselin P, et al. 2020. Physiological factors characterizing heat-vulnerable older adults: a narrative review. Environ Int 144:105909, PMID: , 10.1016/j.envint.2020.105909. [DOI] [PubMed] [Google Scholar]
- 55.Chodzko-Zajko WJ, Proctor DN, Fiatarone Singh MA, Minson CT, Nigg CR, Salem GJ, et al. American College of Sports Medicine. 2009. Exercise and physical activity for older adults. Med Sci Sports Exerc 41(7):1510–1530, PMID: , 10.1249/MSS.0b013e3181a0c95c. [DOI] [PubMed] [Google Scholar]
- 56.Kenney WL, Munce TA. 2003. Invited review: aging and human temperature regulation. J Appl Physiol (1985) 95(6):2598–2603, PMID: , 10.1152/japplphysiol.00202.2003. [DOI] [PubMed] [Google Scholar]
- 57.Kenney WL. 1985. A review of comparative responses of men and women to heat stress. Environ Res 37(1):1–11, PMID: , 10.1016/0013-9351(85)90044-1. [DOI] [PubMed] [Google Scholar]
- 58.Iyoho AE, Ng LJ, MacFadden L. 2017. Modeling of gender differences in thermoregulation. Mil Med 182(S1):295–303, PMID: , 10.7205/MILMED-D-16-00213. [DOI] [PubMed] [Google Scholar]
- 59.Shoenfeld Y, Udassin R, Shapiro Y, Ohri A, Sohar E. 1978. Age and sex difference in response to short exposure to extreme dry heat. J Appl Physiol Respir Environ Exerc Physiol 44(1):1–4, PMID: , 10.1152/jappl.1978.44.1.1. [DOI] [PubMed] [Google Scholar]
- 60.Widerynski S, Schramm PJ, Conlon KC, et al. 2017. Use of cooling centers to prevent heat-related illness : summary of evidence and strategies for implementation. NC for EH (U.S). D of EH and HE, ed. July. https://stacks.cdc.gov/view/cdc/47657.
- 61.Aram F, Higueras García E, Solgi E, Mansournia S. 2019. Urban green space cooling effect in cities. Heliyon 5(4):e01339, PMID: , 10.1016/j.heliyon.2019.e01339. [DOI] [PMC free article] [PubMed] [Google Scholar]
- 62.Hanson HM, Schiller C, Winters M, Sims-Gould J, Clarke P, Curran E, et al. 2013. Concept mapping applied to the intersection between older adults’ outdoor walking and the built and social environments. Prev Med 57(6):785–791, PMID: , 10.1016/j.ypmed.2013.08.023. [DOI] [PubMed] [Google Scholar]
Associated Data
This section collects any data citations, data availability statements, or supplementary materials included in this article.