Figure 1.
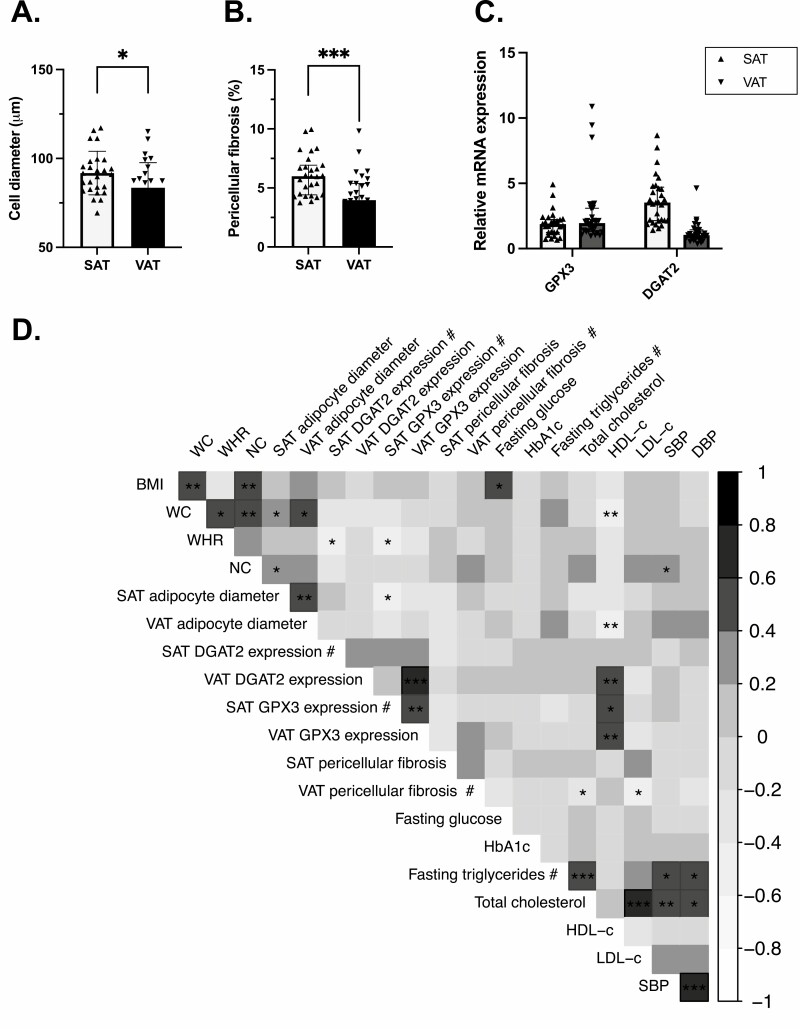
Features of adipose tissue dysfunction. Differences in mean adipocyte diameter (μm) (N = 26, SAT vs N = 27, VAT) (A), pericellular fibrosis (%) (N = 27, SAT vs N = 29, VAT) (B) and the expression of DGAT2 (N = 30, SAT vs N = 30, VAT), implicated in triglyceride biosynthesis, and GPX3 (N = 30, SAT vs N = 30, VAT), associated with lower intracellular reactive oxygen species (ROS) production (C) in SAT and VAT. Pearson correlation coefficient range and P values (D) for untransformed and log10-transformed (#) variables. Correlations with HbA1c were assessed with Spearman’s rank coefficients. The gray intensity reflects the strength of the correlation (Pearson’s r or Spearman’s rho), strong positive associations are illustrated in black while strong negative association in white.

