Fig. 3.
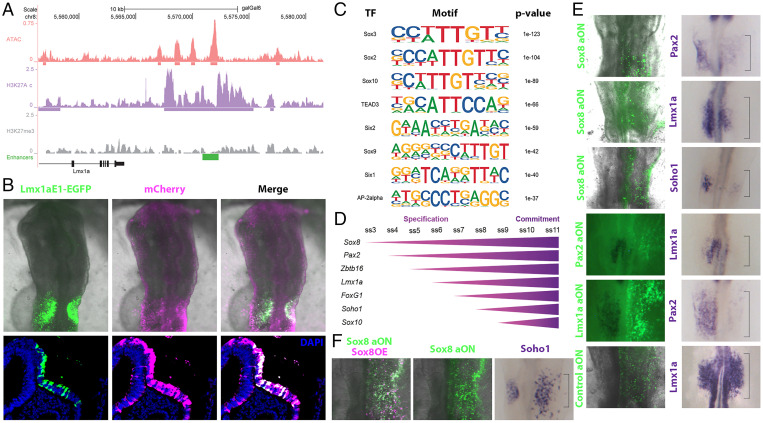
Identification of putative regulatory regions in OEPs. (A) Genome browser view of ATAC, H3K27ac, and H3K27me3 profiles in OEPs at the Lmx1a locus. Cloned putative enhancer is shown in green. (B) Coelectroporation of Lmx1aE1-EGFP reporter (green) and constitutive mCherry (magenta) reveals in vivo enhancer activity in the otic placode. Sections reveal that the enhancer activity is restricted to the ectoderm at the level of the otic placode: Lmx1aE1 in green, constitutive mCherry in magenta, and DAPI in blue. (C) Motif enrichment analysis of all identified enhancers. (D) Diagram showing the onset of expression of potential otic regulators during specification and commitment stages. (E) Unilateral knockdown of selected TFs using fluorescein-labeled aON (green) leads to down-regulation of otic markers as shown by in situ hybridization (purple) on the targeted side of the embryo. Note: fluorescent images were taken prior to in situ hybridization for Sox8 aON and controls. (F) Unilateral coelectroporation of Sox8 aON (green) and Sox8-mCherry construct (magenta) on the right side of the embryo restores Soho1 expression in the otic territory. Sox8 OE, Sox8 overexpression.

