Fig. 1.
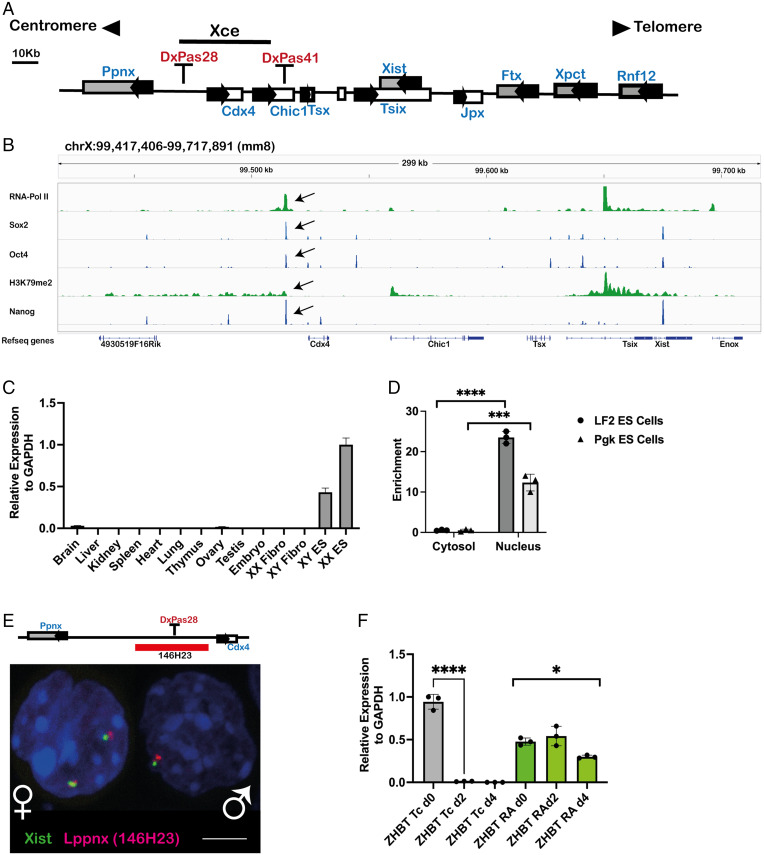
A long noncoding RNA is transcribed from the predicted X-controlling element. Schematic view of the X-inactivation center with the predicted Xce indicated by a black bar (A). ChIPseq analysis shows a clear signal, marked with a black arrow, for the pluripotency factors Oct4, Nanog and Sox2 within the Xce. RNA-Pol II and H3K79m2 indicate initiation and maintenance of active transcription (B). The transcript identified in B is mainly expressed in mouse male and female ES cells but not in differentiated cells, as exemplified by organ analysis of adult mice. Relative expression levels of the transcript were measured by qRT-PCR in mouse organs, embryos, and cell lines. XX Fibro: Female fibroblast cell line, XY Fibro: Male fibroblast cell line. XX ES: Female embryonic stem cell line XY ES: Male embryonic stem cell line. (C). Fractionation of cytosol and nuclei in two ES cell lines, LF2 and Pgk, reveals the localization of the transcript to be mainly in the nucleus, indicating a bona fide lncRNA transcript. Enrichment in the two compartments was measured using qRT-PCR. Two-sample t test: P < 0.0001(LF2), P = 0.0006 (Pgk) (D). Visualization of the transcript in the nucleus of male and female ES cells using RNA-FISH. The position of the BAC used as FISH probe is highlighted as a red bar (E). The expression of the transcript depends on Oct4. Oct4-deficient ES cell line (ZHBT) which carries a tetracycline-repressible Oct4 transgene was differentiated either in the presence (RA) or absence (TC) of Oct4. In the absence of Oct4 (Tc) the transcript is rapidly down-regulated during differentiation, whereas the maintenance of Oct4 during differentiation (RA) maintains also the transcription. Transcript levels are shown relative to glyceraldehyde-3-phosphate dehydrogenase (GAPDH). Two-sample t test: P < 0.0001. One-way ANOVA: P = 0.0143 (F).

