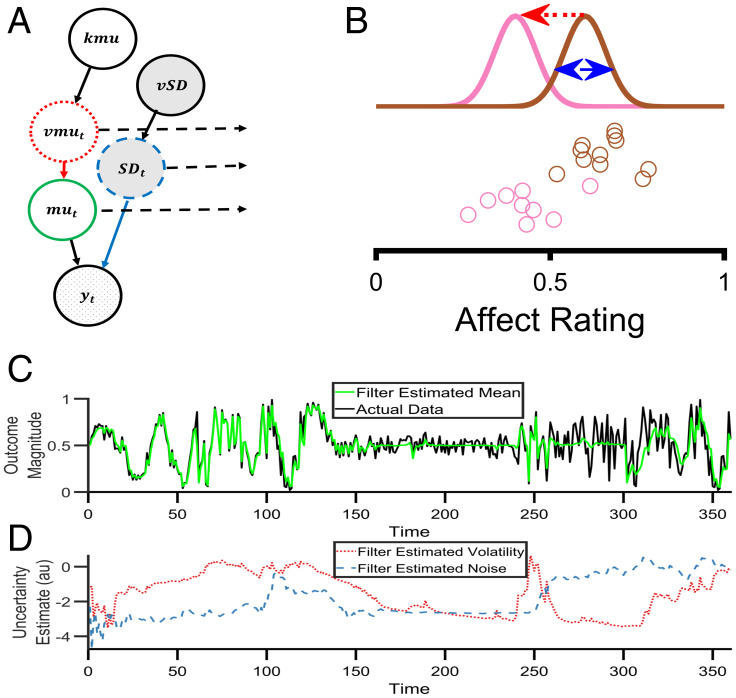
Fig. 1.
A Bayesian filter to estimate types of affective variability. (A) A graphical illustration of the generative model that describes how affect ratings (represented by ) are produced at each time point. The hypothesized causal processes leading to the production of the ratings is controlled by the nodes , , ,, and , which are described in the main text. (B) An illustration of the types of variability in the generative model. Circles represent individual affect ratings, sequentially generated from top to bottom. The color of the circle indicates the distribution from which it was drawn. One type of variability, volatility (, red arrow), arises from a shift in the distribution (from brown to pink), leading to a change in all subsequent ratings. A second type of variability, noise (, blue arrow), arises from the sampling of the ratings from the distributions and leads to independent changes in each rating. (C) Behavior of the Bayesian filter using synthetic data. The black line illustrates a time series of synthetic data drawn from the range 0–1. The data contains periods in which volatility is high (time 1–120 and 301–360) and others in which it is low (time 121–300). Similarly, it contains periods in which noise is high (time points 61–120 and 241–360) and low (time 1–60 and 121–240). The green line illustrates the Bayesian filter's belief about the mean of the generative process, , at each time point. As can be seen, the filter changes its estimate of the mean when it thinks variability in the data is caused by volatility (e.g., time 1–60) and does not alter its estimate of the mean when it thinks variability is caused by noise (e.g., time 260–300). It is able to adapt to changes in the level of volatility and noise, although it occasionally misattributes the cause (e.g., when the noise increases at time 240, the filter initially believes this is caused by an increase in volatility before correctly attributing it to noise by time 260). (D) The filter's estimate of volatility (red line) and noise (blue line) from the same synthetic data as (C). Panels C and D are adapted from ref. 20.

