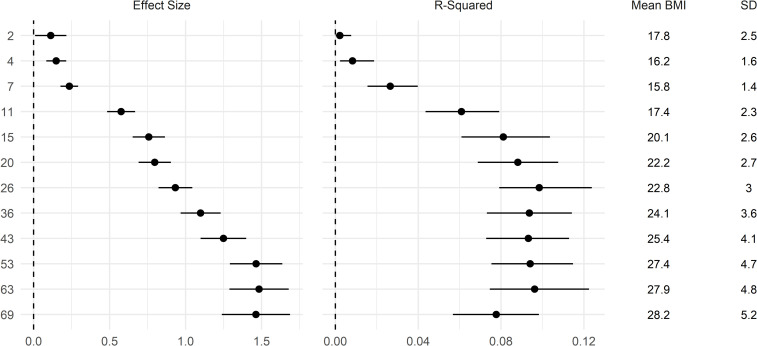
Fig 2. Association between a polygenic index and body mass index (BMI) across life.
Drawn from OLS regressions including adjustment for sex and the first 10 genetic principal components, repeated for each polygenic index and age at follow up. Left panel: coefficients: difference in BMI per 1 SD increase in polygenic index (95% CI). Right panel: incremental R2 compared with OLS regression model of BMI on sex and first 10 genetic principal components (95% CI estimated using bootstrapping [500 replications, percentile method]). Polygenic index from Khera et al [4]; used an initial sample of adults.

