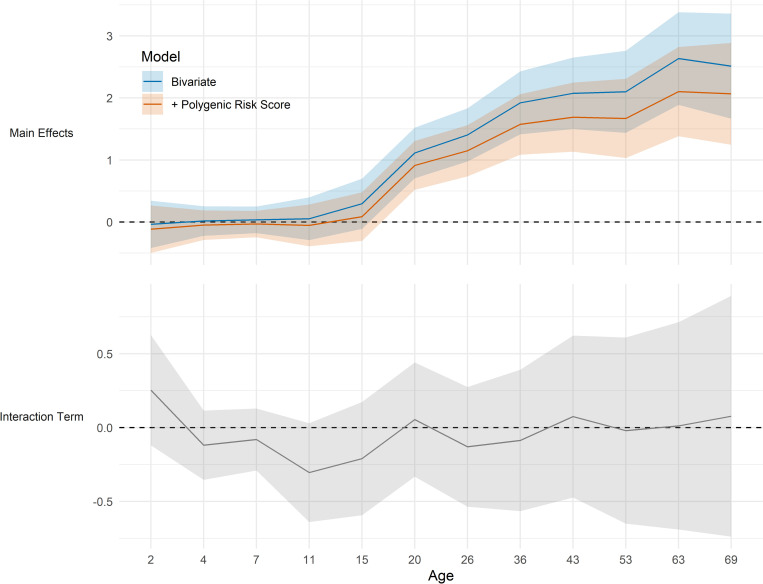
Fig 4. Childhood socioeconomic position and polygenic index in relation to body mass index (BMI) across life.
Top panel shows the kg/m2 difference in BMI in the lowest compared with highest socioeconomic position, before and after adjustment for Khera et al. (2019)[4] polygenic index for higher BMI. Bottom panel shows coefficients for the social class x polygenic index interaction term (null line is evidence for no interaction). SEP measured as father’s occupational class converted to ridit score. Results from top panel drawn from OLS regression models including adjustment for sex (blue solid line) and further adjustment for polygenic indices and first ten genetic principal components (orange line). Results from bottom panel drawn from OLS regression models including adjusted for sex, polygenic index [4], first ten genetic principal components and SEP.

