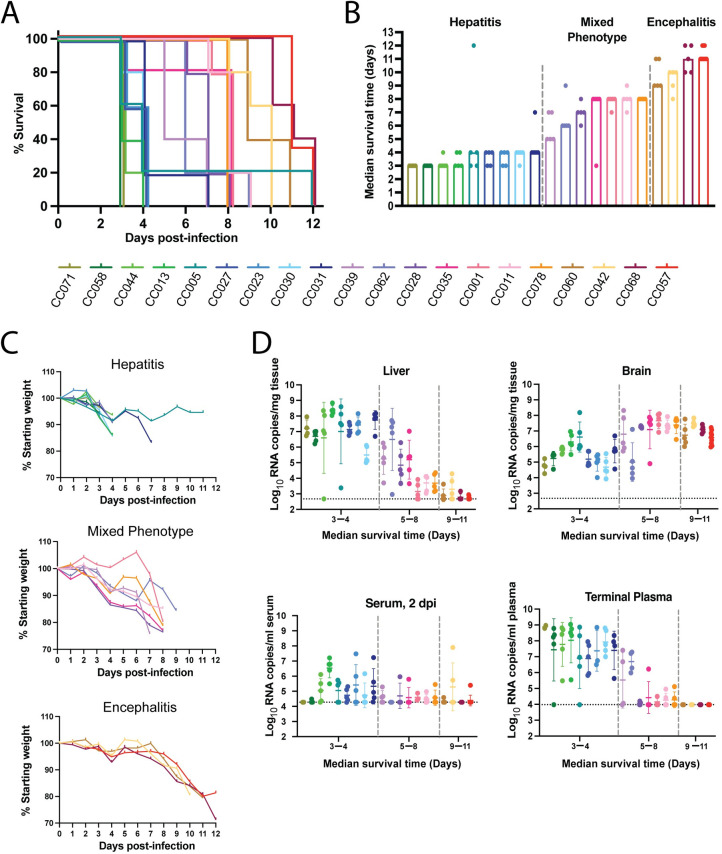
Fig 1. Disease phenotypes identified after RVFV infection in CC strains.
A) Survival curve of 20 different CC mouse strains following RVFV infection. Each line represents 5 female mice apart from CC057 mice (n = 9, 5 female and 4 male). B) Median time to death across CC strains. C) Mean percent of starting body weight over the course of infection with CC strains split into three categories of disease. D) qRT-PCR based assessment of viral RNA loads in serum at 2 dpi and from tissues and plasma at time of euthanasia. CC strains are separated into three categories of disease by two dashed vertical grey lines. Serum and plasma viral loads were assessed if sufficient sample was present (n≤5 per CC strain) with data shown as geometric mean ± geometric SD. LOD of assays noted by dotted horizontal line.

