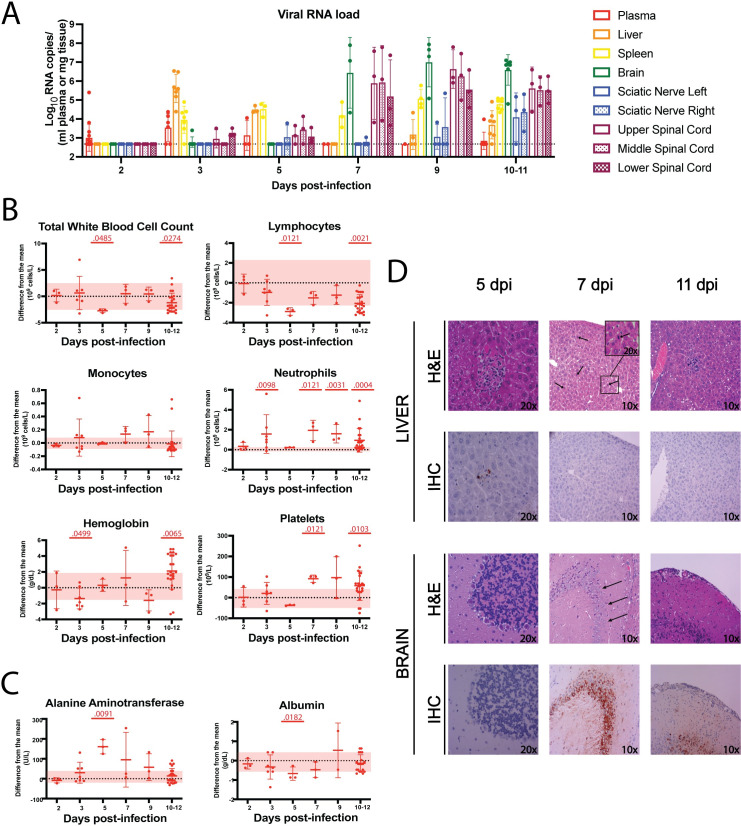
Fig 6. CC057 mice progress on to late-onset encephalitis after a self-limited hepatitis.
A) qRT-PCR assessment of viral RNA loads in CC057 plasma and tissues over time. Data shown as geometric mean ± geometric SD (N = 1-16/tissue type). LOD for tissue samples noted by dotted line at 473 RNA copies. LOD for plasma samples = 18,960 RNA copies. B) CBC and C) CHEM over time with data presented as a function of difference from the uninfected mean, shown as mean ± SD (n = 3–23 mice/time point). Each data point shown represents an individual mouse. The uninfected means and normal ranges for CC057 mice were determined by performing CBC and CHEM on blood from 9 uninfected CC057 mice. 2 and 3 dpi data previously presented in Fig 5A and 5B. Pink horizontal shading represents uninfected normal ranges from the mean for CC057 mice. Comparisons of CBC data were performed at each timepoint by Mann-Whitney to compare RVFV-infected samples to uninfected control samples (Total white blood cells 5 dpi p = 0.0485, 10–12 dpi p = 0.0274; Lymphocytes 5 dpi p = 0.0121, 10–12 dpi p = 0.0021; Neutrophils 3 dpi p = 0.0098, 7 dpi p = 0.0121, 9 dpi p = 0.0031, 10–12 dpi p = 0.0004; Hemoglobin 3 dpi p = 0.0499, 10–12 dpi p = 0.0065; Platelets 7 dpi p = 0.0121, 10–12 dpi p = 0.0103). Comparisons of CHEM data were performed at each timepoint by Mann-Whitney to compare RVFV-infected samples to uninfected control samples (ALT 5 dpi p = 0.0091; Albumin 5 dpi p = 0.0182). D) Representative H&E-stained sections of formalin-fixed paraffin-embedded livers and brains from RVFV-infected CC057 mice at different times post-infection. Liver arrows point to active hepatocellular mitotic events while brain arrows point to neuronal dropout. IHC of RVFV antigen (brown) in representative sections of formalin-fixed paraffin-embedded RVFV-infected livers and brains at different times post-infection. The presented brain images are from different regions of the brain: cerebellum (5 dpi), hippocampus (7 dpi), and cortex (11 dpi).

