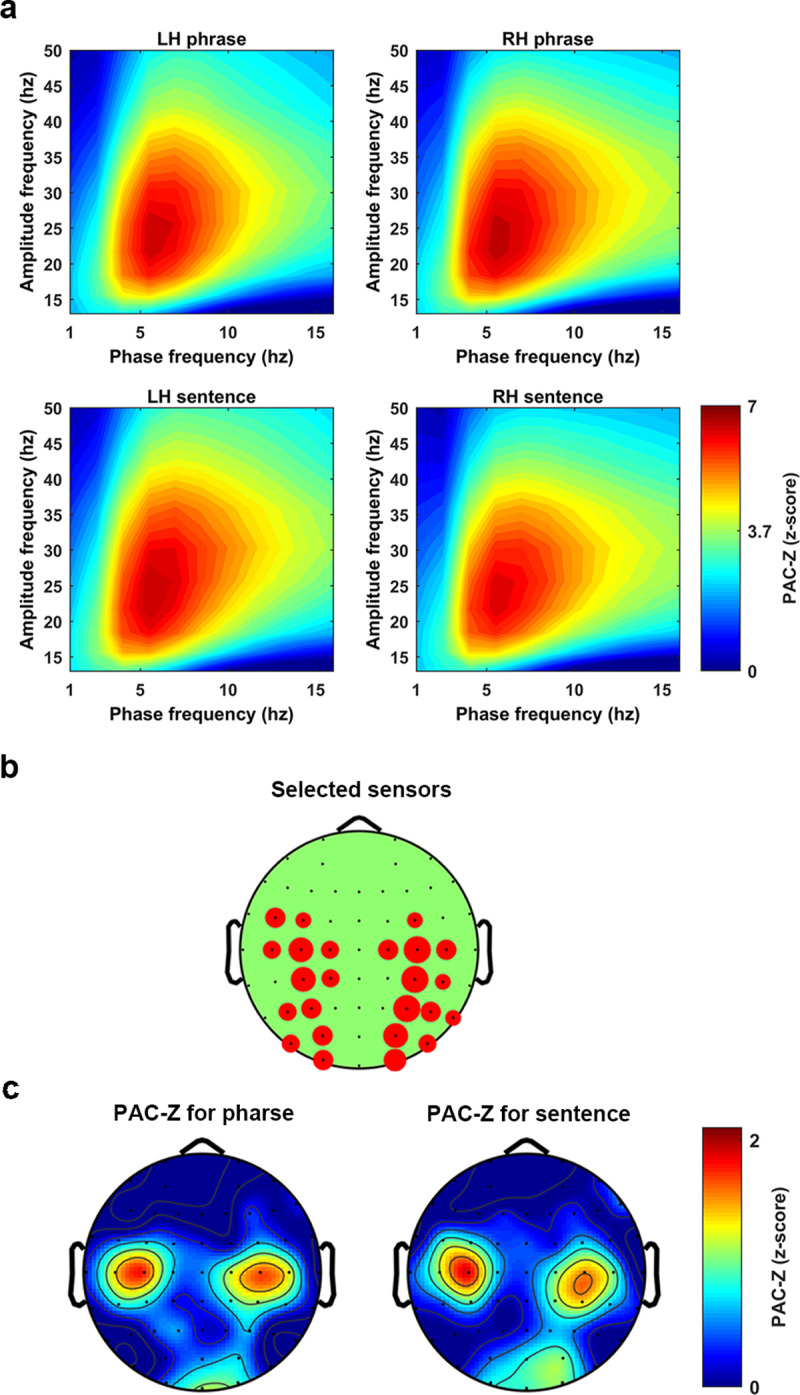
Fig 4. PAC as a general mechanism for speech perception.

The figure shows a z-score transformed PAC, PAC-Z. (a) The PAC-Z for the phrases and the sentences at each hemisphere. Each figure was created by averaging 8 sensors which showed the biggest PAC-Z over the ROI. A z-score transformation with Bonferroni correction was conducted to test the significance, which lead to the threshold to be 3.73 corresponding to p-value equals 0.05. (b) The figure shows how sensors were selected at each hemisphere. The bigger the red circle indicates the more times this sensor was selected across participants. (c) The topographical distribution of the PAC-Z, which indicates the PAC was largely localized at the bilateral central areas. PAC, phase amplitude coupling; ROI, region of interest.
