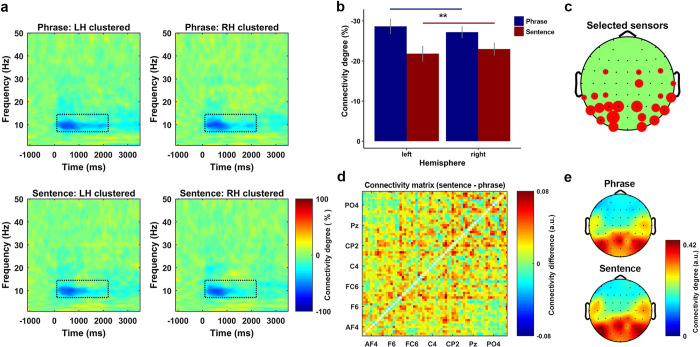
Fig 6. Power connectivity in the alpha band suggests a separation between phrases and sentences.
(a) Power connectivity degree for all conditions. Each plot was clustered by the sensors at each hemisphere that showed the biggest inhibition on the grand averaged power connectivity. (b) The results of a two-way repeated measures ANOVA for the power connectivity on the factors of stimulus-type (phrase or sentence) and hemisphere (left or right). The results indicate a significant main effect of stimulus-type, post-hoc comparison on the main effect indicated that the overall inhibition level of the power connectivity was stronger for the phrases than the sentences (t (29) = 2.82, p = 0.0085 **, two-sided). (c) How sensors were selected for the clustering. The size of the red circle indicates the more times the sensor was selected across participants. (d) The connectivity differences between the phrases and the sentences on all sensor pair. The figure was drawn using the average of the binarized connectivity matrix of the sentences minus the matrix of the phrases. The results indicate that the connectivity degree over the sensor space for the sentences was higher than the phrases. (e) Topographical representation of the binarized connectivity, which was clustered using the sensors showed biggest inhibition on the power connectivity. The upper and lower panel shows the phrase and sentence condition, respectively.

