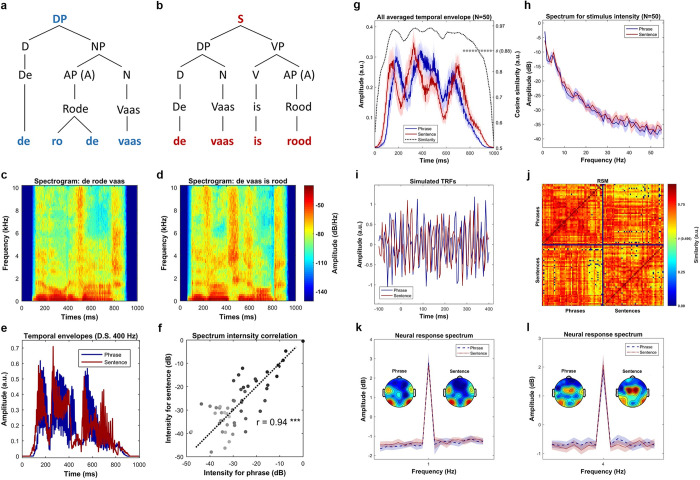
Fig 8. Stimulus comparison between phrases and sentences.
(a) Syntactic structure of phrases, which is represented by a sample phrase, de rode vaas (the red vase). The DP can first be decomposed into a determiner (D) and a NP, in which the NP can be separated into an AP, which equivalents to an adjective (A), and a noun (N). Finally, these words can be decomposed into 4 syllables. (b) Syntactic structure of sentences, which represented by a sample sentence, de vaas is rood (the vase is red). The sentence can be decomposed into two parts, which are a DP and a VP, respectively. The DP can then be separated into a determiner (D) and a noun (N), and the VP can be separated into a combination between a verb (V) and an adjective (A). All these words are finally decomposed into four syllables. (c) and (d) shows the spectrogram of the sample phrase and the sample sentence, respectively. The comparison between the spectrograms indicates a similar pattern between these 2 types of stimulus. (e) shows the comparison of the temporal envelopes of the sample phrase–sentence pair, i.e., De rode vaas (the red vase) versus De vaas is rood (the vase is red), which were down sampled to 400 Hz. The comparison suggests a similar energy profile of the sample pair. (f) shows the spectrum for the sample phrase–sentence pair, in which the horizontal axis and the vertical axis indicates the frequency response of the temporal envelop of the phrase and the sentence, respectively. The darker the dot indicates the higher the frequency. The Pearson correlation suggested that the spectrum is highly similar between the sample phrase and the sample sentence (r = 0.94, p < 1e-5 ***). (g) shows the averaged temporal envelope of these 2 types of stimuli, blue for phrase and red for sentence. The black dotted line indicates a highly similar physical properties between them in time domain by cosine similarity. Statistical analysis on the similarity measure using permutation test indicated an inseparable pattern. (h) Spectrum of the averaged envelopes for the two types of speech stimuli. The shaded area for each condition covers two SEM. across the mean (N = 50). Statistical analysis using Bayesian inference suggested a highly similar frequency response. (i) Shows the results of simulations using TRF. Statistical analysis using pairwise t-test indicated no difference between the two types of stimuli in every single time point, which suggests indistinguishable acoustics betwen the stimuli. (j) Similarity comparison for all possible stimuli pairs. As shown in the RSM, the upper-left and lower-right panel shows the comparison of all phrase-pair and all sentence-pair, respectively. The upper-right and lower-left matrix shows the comparison of all possible phrase–sentence pairs. Statistical comparison using permutation test indicated a highly similar acoustic properties across all possible pairs. (k) Shows the frequency tagging effect at 1 Hz. The figure shows a strong peak at 1 Hz for the phrases (t (14) = 8.72, p < 4.9e-7 ***) and the sentences (t (14) = 8.46, p < 7.1e-7 ***). It reflects that syntactic integration happened at 1 Hz, and our duration (1 second) normalization is effective. However, no difference of the 1-Hz activity was found between the conditions, which indicates a difficulty to separate the types of syntactic structures (t (14) = 0.63, p = 0.53) using frequency tagging approach. (l) shows the frequency tagging effect at 4 Hz. The strong 4 Hz peak for the phrases (t (14) = 7.79, p < 1.8e-6 ***) and the sentences (t (14) = 9.43, p < 1.9e-7 ***) suggests that syllables were the initial processing units for syntactic integration. AP, adjective phrase; DP, determiner phase; NP, noun phrase; TRF, temporal response function; VP, verb phrase.

