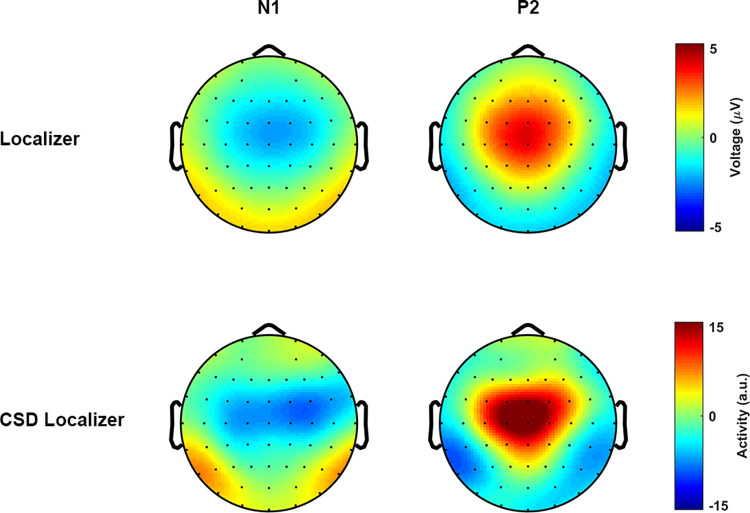
Fig 10. Effect of volume conduction attenuation.
The topographical distribution of the canonical auditory N1-P2 complex. The upper panel shows the N1-P2 complex that was averaged over all participants (N = 15). The lower panel shows the N1-P2 complex after Surface Laplacian (CSD), in which the effect of volume conduction was attenuated. CSD, current source density.

