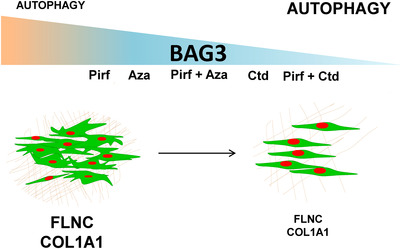
FIGURE 7.

Schematic representation of this study. Restoring insufficient BAG3‐mediated autophagy in IPF fibroblasts by the indicated drugs. The slope represents the synergistic effect of the indicated drugs on BAG3 inhibition. Small font indicates decreased expression or decreased autophagy flux and vice versa. To the left, highly proliferative IPF fibroblasts (green) are depicted, enwrapped in thick extracellular matrix (brown) with increased BAG3, FLNC and COL1A1 and insufficient BAG3‐mediated autophagy. To the right, decreased IPF fibroblast proliferation, decreased FLNC, COL1A1 and BAG3 protein levels and restored autophagy upon treatments with the indicated drugs is shown
