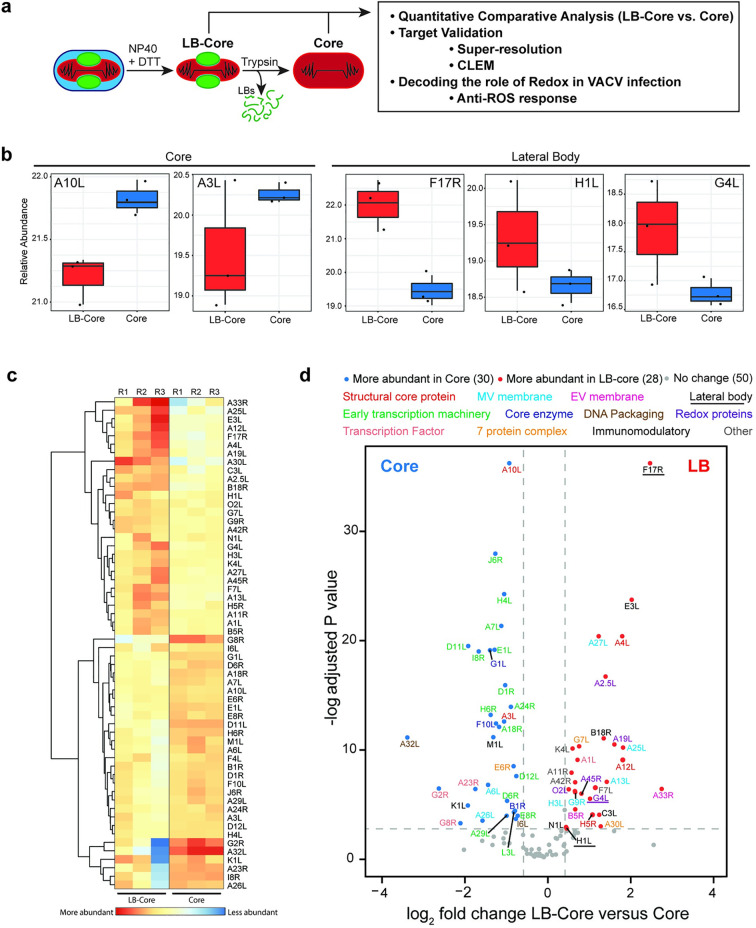
Fig 1. Defining the VACV LB spatial proteotype.
(a) Schematic of controlled degradation of purified VACV MVs used in this study (details in Materials and Methods). (b) Relative abundance plots of known core (A10L, A3L) and LB (F17R, H1L, G4L) proteins across LB-Core and Core fractions. (c) Heat map showing the relative abundance of VACV proteins between LB-Core and Core fractions. (d) Relative abundance of viral proteins in LB-Core versus Core fractions. Proteins are colour coded with regard to LB-Core vs. Core abundance: more (red), less (blue) or no difference (grey). Experiments were performed in triplicate and significance scored as a minimum of two-fold greater in LB-Core vs. Core samples. An adjusted p-value ≤ 0.08 cut off was set using the adjusted p-value of the bone fide VACV LB protein H1L (c-d).

