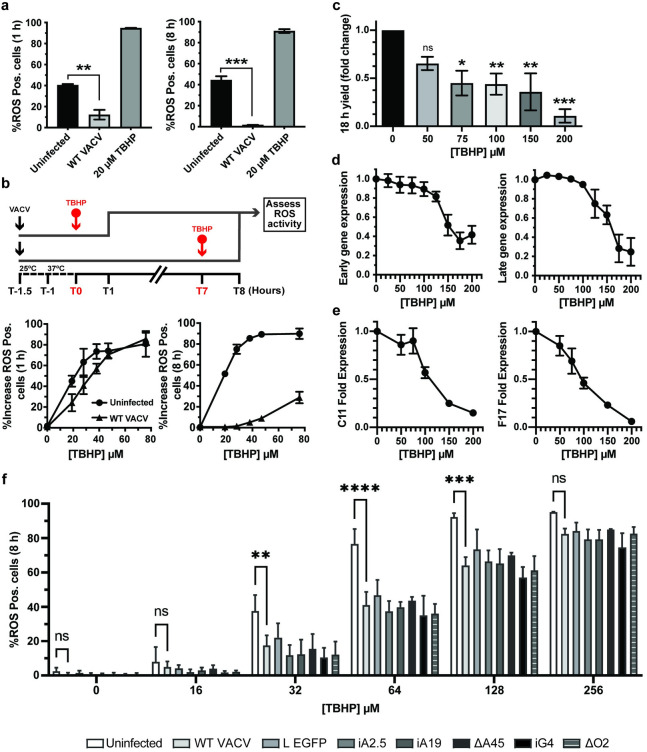
Fig 4. VACV supresses host cell oxidative responses to promote infection.
(a) The percentage of ROS activated A549 cells measured at 1 and 8 h pi in cells left uninfected (black bar) or infected with WT VACV (Light grey bar). As a positive control, uninfected cells were treated with 20 μM TBHP for the final hour of the experiment (dark grey bars). (b) Top: schematic of experiment to assess impact of VACV infection on ROS activation. VACV was bound to A549 cells for 30 min at RT prior to being shifted to 37°C for 1 h. Cells were challenged with the indicated concentrations of ROS inducer TBHP for 1 h prior to quantification of ROS-positive cells at 1 h pi and 8 h pi. Bottom: The percentage of uninfected (circles) and infected (triangles) ROS positive cells at 1 h pi and 8 h pi challenged for the final hour with the indicated concentrations of TBHP (n = 3; ± SEM). (c) A549 cells were infected with WT WR VACV (MOI = 1) in a range of TBHP concentrations. At 18 h pi, the infectious virus yield was assessed by plaque assay (n = 3; mean ± SEM). (d) A549 cells infected with WR E-EGFP or L-EGFP were challenged with the indicated concentrations of TBHP for 8 h. Early and late viral gene expression was assayed by flow cytometry and the data plotted as the fold change from infected untreated cells (n = 3; mean ± SEM). (e) A549 cells infected with WT VACV were challenged with the indicated concentrations of TBHP for 8 h. Total RNA was extracted and early (C11R) and late (F17R) gene expression assessed by RT-qPCR. Data is displayed as fold expression normalised to GAPDH (n = 3 ± SEM). (f) Following the schematic in (b), the percentage of ROS activated A549 cells was measured using MitoSOX Red at 8 hpi in uninfected (white bar) or WT, WR L-EGFP, iA2.5, iA19, ΔA45, iG4, or ΔO2 infected cells and treated with indicated concentrations of TBHP for the final hour of the experiment (n = 3 ± SD). (a, c, f) *P<0.05, **P<0.005, ***P<0.0005.

