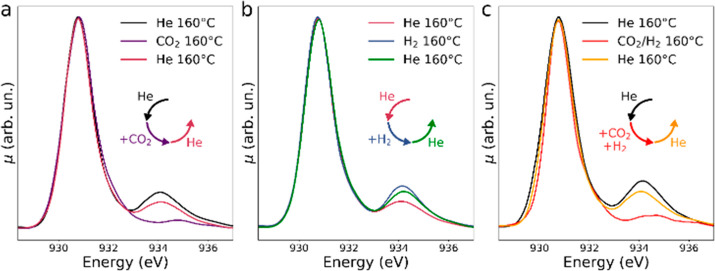
Figure 3.
Series of Cu L3-edge AP-NEXAFS spectra of HKUST-1: (a) collected at 160 °C in 1 bar of He flux before (black line) and after exposure to CO2 (violet line), and in 1 bar of He flux after removal of CO2 (dark red line), (b) in 1 bar He flux before (dark red line) and after exposure to H2 (blue line), and in 1 bar of He flux after removal of H2 (green line), (c) at 160 °C in a 1 bar flux of He before (black line), during (red line) and after exposure to a flux of a gaseous mixture containing CO2 (2%) and H2 (6%) (orange line). In order to aid the visualization, in each panel the chronological order with which the spectra were measured is portrayed using sets of arrows arranged in circles whose colors match those of the corresponding presented spectra and whose orientations evidence the temporal sequence with which each spectrum was collected.

