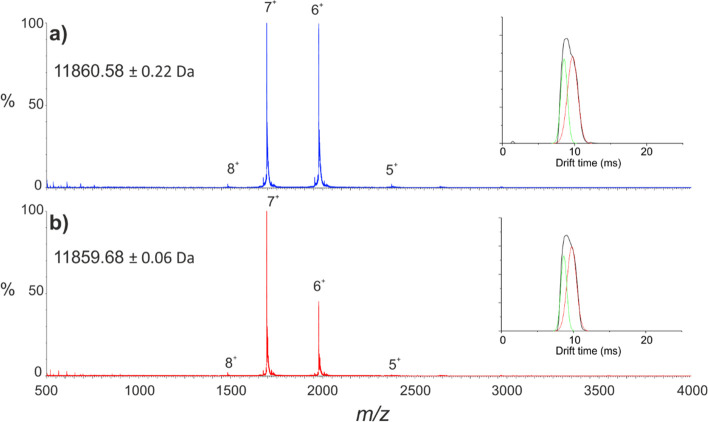
Figure 2.
Native ESI-IMS-MS analysis of wild-type and D76N β2m. Native ESI-MS spectra for (a) wild-type β2m (blue) and (b) the D76N variant (red). Peaks are annotated with charge states. Calculated masses and standard deviations from each spectrum are shown in the top left-hand corner. Insets show the IMS arrival time distribution for the 6+ charge states (raw data are shown in black; fitted Gaussian curves in green and red).

