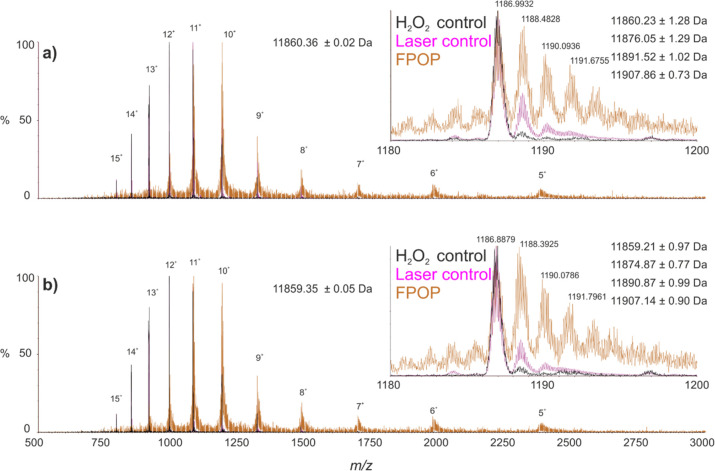
Figure 3.
Denatured ESI-MS spectra of intact wild-type and D76N β2m following FPOP exposure. FPOP oxidized (orange) and non-FPOP control samples without irradiation (purple) and without irradiation or H2O2 exposure (black) are shown for (a) wild-type β2m and (b) the D76N variant. Peaks are annotated with charge state. Average mass and standard deviation for the control spectra without irradiation or H2O2 exposure are shown. Insets highlight the 10+ charge state ions from each spectrum. Calculated masses and standard deviations from each species observed in the FPOP oxidized spectra are shown in the top right-hand corner.

