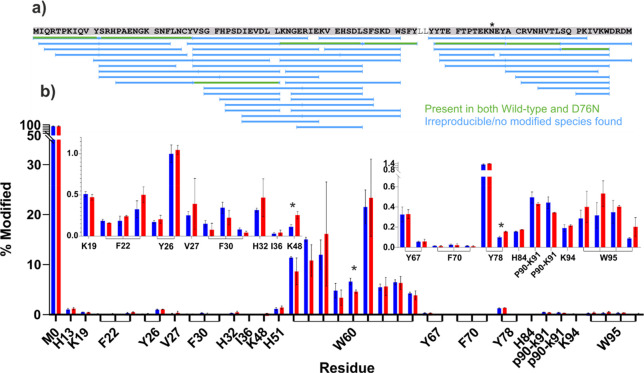
Figure 4.
Residue level FPOP–LC–MS/MS analysis of wild-type and D76N β2m. (a) Sequence coverage map of the chymotrypsin digest of FPOP samples. Peptides used for quantification, which were present in all three replicates for both proteins, and which were observed to be present in both oxidized and unoxidized forms, are shown in green. The variant position, residue 76, is marked with a *. (b) Quantification of modified side chains for wild-type (blue) and D76N (red) β2m. Residues for which the quantification data are shown are annotated on the x axis. Instances where MS/MS data were insufficient to identify individual residues as the modified site show the range of residues to which the modification could be localized. Insets show zoomed y axis for regions K19–K48 (left) and Y67–W95 (right). Products identified as the same species at different retention times (i.e., positional isomers) are linked on the x-axis with brackets. Bars highlighted with an * indicate differences where p < 0.01. Error bars show standard deviation, n = 3.

