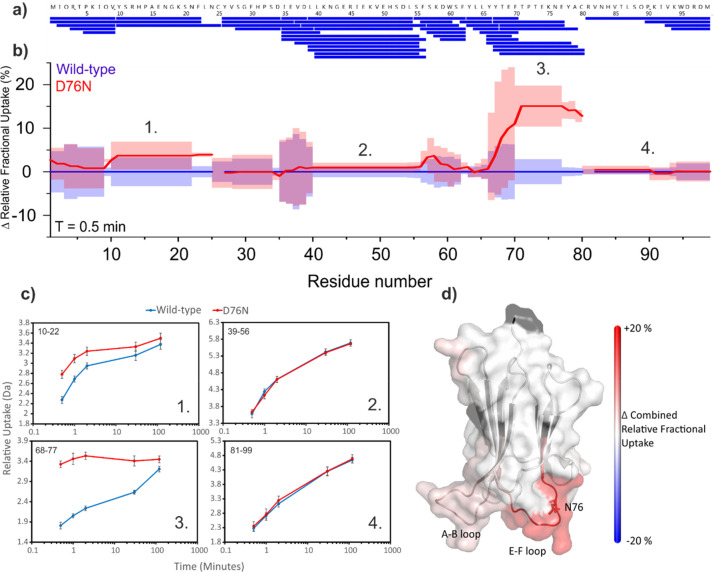
Figure 6.
Differential HDX between wild-type and D76N β2m. (a) Sequence coverage map of the pepsin digest of HDX samples. (b) PAVED8 plot for the 30 s incubation time-point showing combined relative fractional uptake for wild-type β2m (blue, set to 0 for reference) and the D76N variant (red). Shaded regions show combined standard deviation, n = 5. (c) Uptake plots for four peptides covering different regions of β2m (numbered 1–4, positions in the protein sequence are as annotated in the PAVED plot in Figure 6b). Residues covered by each peptide are annotated in the top left-hand corner of each plot. Error bars show standard deviation, n = 5. (d) Structural heat map of differential hydrogen exchange. Black regions indicate the absence of data. Only statistically significant differences are shown (p < 0.05 based PAVED algorithm8) with an increase in deuterium incorporation for D76N β2m shown in red. PDB: 4FXL.33

