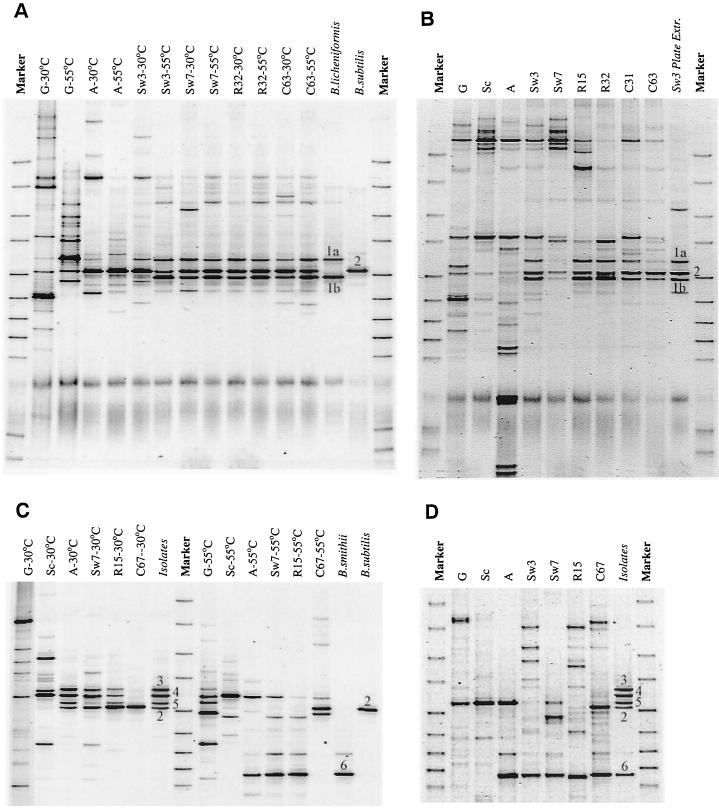
FIG. 5.
Changes during vanilla curing in DGGE profiles of the amplified V3 region of the bacterial 16S rDNA of microorganisms extracted from TSA plates 3 days after inoculation with an extract of vanilla beans (A and C) and of microbial communities directly isolated from vanilla beans, without intermediate cultivation (B and D). (A and B) Tulungagung experiment. (C and D) Payung experiment. Sampling times are indicated by a letter depicting the stage from which the sample was obtained, followed by a number referring to the number of days the particular stage has been executed at the time of sampling. G, green beans; Sc, scalding; A, autoclaving; Sw, sunning-sweating; R, rack drying; C, conditioning (see also Fig. 1). The temperature refers to the temperature at which the plates were incubated. In italics are indicated the profiles of isolated strains; the numbers refer to different isolates and are explained in the text and Table 1. The blurry bands near the bottom in panels A and B are artifacts of the PCR-DGGE protocol.

