
FIGURE 2.
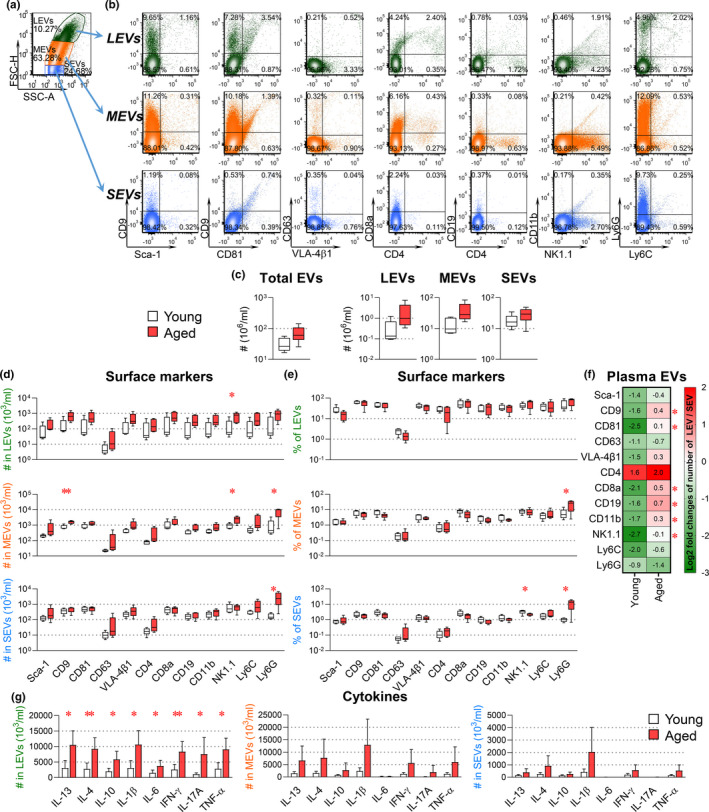
Age‐dependent changes in plasma EV surface markers of hematopoietic cells. Plasma EVs from young and aged mice were profiled for surface markers and intravesicle cytokines. EVs were stained with fluorescence‐conjugated antibodies against the indicated surface markers (a–f). For intravesicle cytokine staining (g), EVs were fixed, permeabilized, and stained with fluorescence‐conjugated antibodies against the indicated cytokines. The percentages and number of EVs carrying each tested molecule were determined by high‐resolution multicolor flow cytometry. (a) Representative color dot plots present size and granularity of LEVs, MEVs, and SEVs. (FSC‐H, forward‐scatter height; SSC, side‐scatter area.) (b) Representative color dot plots present results of all tested surface markers in gated individual plasma EV subsets. The graphs present a summary of the number of total EVs, LEVs, MEVs, and SEVs (c), as well as the number (d) and percentages (e) of EV subpopulations carrying each surface marker. (f) Heat maps presents the relative proportions of numbers of LEV to SEV (LEV/SEV) carrying the same surface markers within young and within aged mice. Positive (+) log2 fold changes of LEV/SEV represent more LEV than SEV, while negative (−) log2 fold changes represent fewer LEV than SEV. The SEV/LEV ratios differ between young and aged mice for seven EV subsets (indicated by *). (g) The graphs present a summary of the number of LEVs, MEVs, and SEVs carrying each cytokine. Comparisons between young and aged mice by an unpaired t test for each marker were performed with results indicated as *p < 0.05 and **p < 0.01. (n = 5 per group)