FIGURE 1.

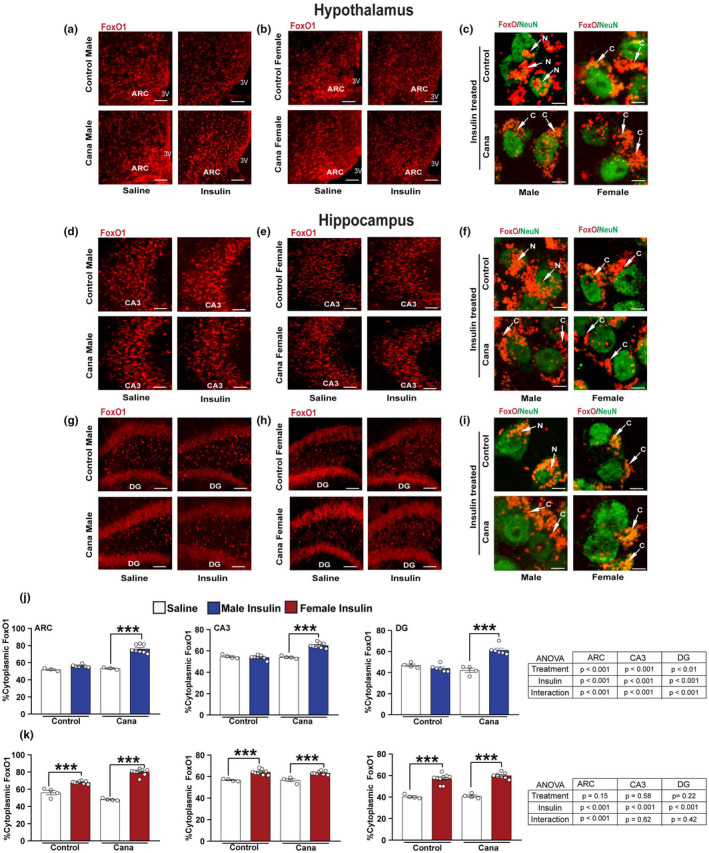
Insulin→FoxO1 signaling in aged Cana treated mice. Immunofluorescence for FoxO1 (red) and NeuN (green) in 30‐months‐old control and Cana treated mice injected with insulin (3 U/kg i.p.; 15 min) or saline. Representative images from the hypothalamus in males (a) and females (b), or hippocampus CA3 in males (d) and females (e), and dentate gyrus (DG) in males (g) and females (h) of control and Cana‐treated mice are shown. Scale bars represent 200 or 10 μm for the left panels for confocal images of insulin‐treated cells, showing FoxO1 (red) merged with NeuN (green) (right) in 30‐months‐old mice of the indicated groups (c, f, and i). White arrows indicate the localization of the FoxO1, C. cytoplasmatic, and N. nuclear. 3 V, third ventricle. Quantification of neurons containing cytoplasmic FoxO1 immunoreactivity in the ARC, CA3, and DG regions in males (j) and females (k); error bars show SEM for n = 4–7 mice/group, 3–4 images from each region/mouse were taken. Data were analyzed by 2‐factor ANOVA and further analyzed with the Newman–Keuls post hoc test (***p < 0.001). The tables demonstrate the two‐factor ANOVA analysis. Confocal images of higher magnification are shown in Figure S1
