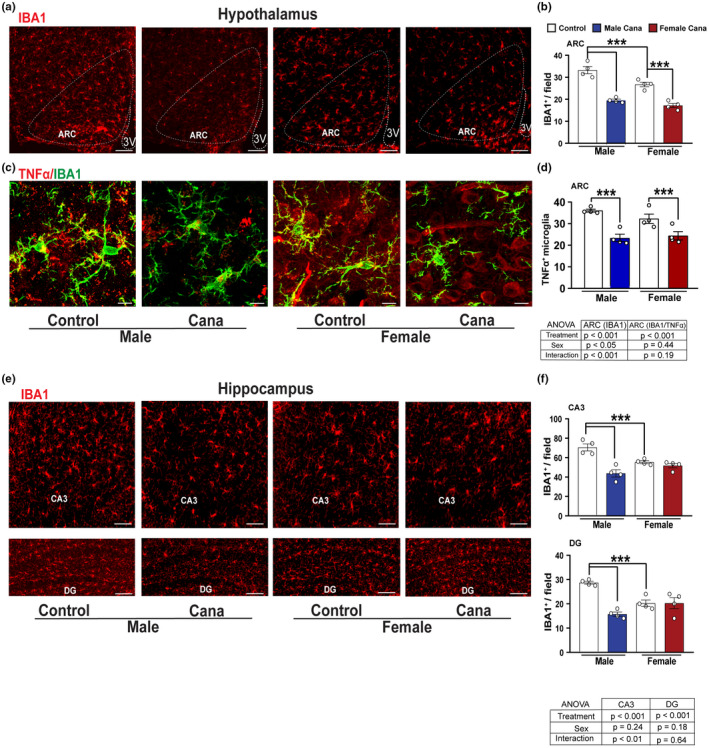
FIGURE 4.

Microgliosis in aged Cana‐treated mice. Representative images showing Iba1+ cells (red) (a) and confocal images showing Iba1 (green) merged with TNF‐α (red) (c) immunostaining in the arcuate nucleus of the hypothalamus (ARC) of control and Cana‐treated 26–28 months‐old male and female mice. Numbers of cells immunoreactive for (b) Iba1 and (d) TNF‐α+/Iba1+ in the ARC of control and Cana‐treated male and female mice. (e) Representative images showing Iba1+ cells (red) in the CA3, and DG of 26–28 months‐old control and Cana treated mice. Numbers of cells immunoreactive for Iba1 in the CA3 and DG (f) from indicated male and female mice; error bars show SEM for n = 4 mice/group. Scale bars: 200 μm, 10 μm on merged images. 3 V, third ventricle. Data were analyzed by 2‐factor ANOVA and further analyzed with the Newman–Keuls post hoc test (***p < 0.001). The tables demonstrate the two‐factor ANOVA analysis
