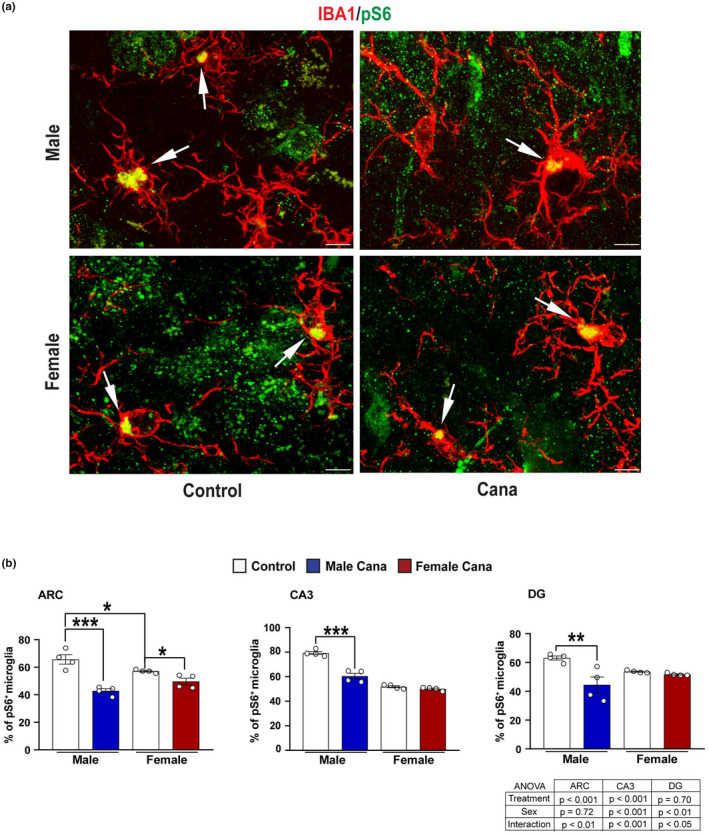
FIGURE 5.

Microglial pS6 expression in Cana treated aged mice. (a) Representative confocal images of phosphorylated S6 (pS6, green) and Iba+ cells (red) in the arcuate nucleus of the hypothalamus (ARC) of 26–28 months‐old control and Cana treated male and female mice. Scale bars: 5 μm, 3 V, third ventricle. (b) Percentage of Iba1+ pS6 in the ARC, CA3, and DG of male and female mice. Error bars show SEM for n = 4 mice/group. Data were analyzed by 2‐factor ANOVA and further analyzed with the Newman–Keuls post hoc test (**p < 0.01; ***p < 0.001). The tables demonstrate the two‐factor ANOVA analysis. Images of lower magnification in the hypothalamus and hippocampus are shown in Figure S8
