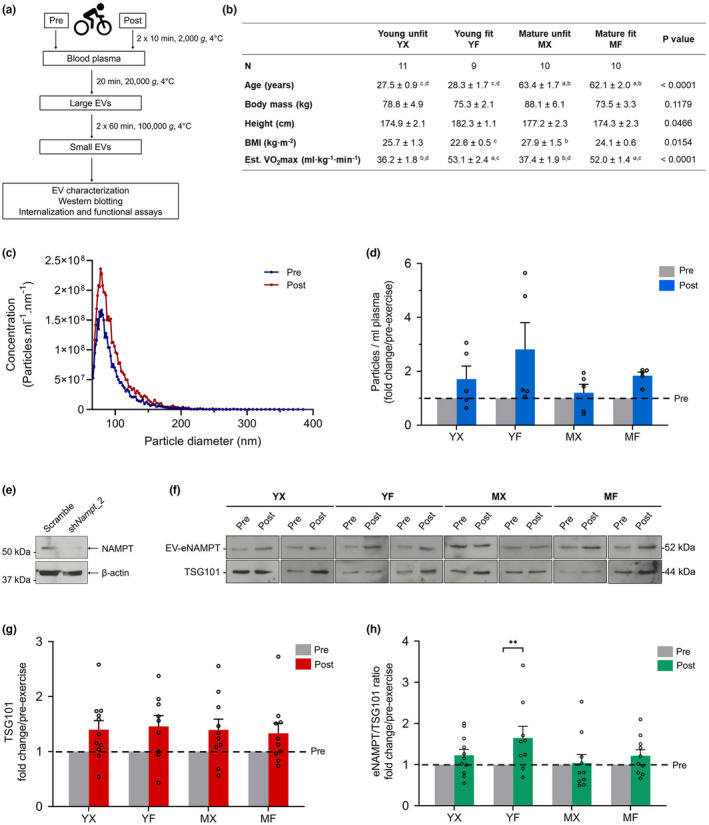
FIGURE 1.

Characterization of EVs released following exercise in healthy adults of different ages and fitness levels. (a) a schematic diagram of the experimental design. (b) the characteristics of the study participants (n = 9–11 per group). Est. VO2max, estimated maximum oxygen consumption. (a), (b), (c), and (d) denote the columns and the statistical differences. (c) Representative size distribution profile of EVs of a participant, here showing an MX group participant collected at pre‐ and post‐exercise. (d) Individual (circle) and mean (bar) fold changes of total particle counts of EVs collected at pre‐ and post‐exercise (n = 5 per group). (e) Western blot for NAMPT in C2C12 cell lysates with either scrambled or shRNA knockdown of NAMPT. (f) Representative Western blot analysis of TSG101 and eNAMPT from exercise‐EVs. (g) Individual (circle) and mean (bar) fold changes of densitometric quantification of TSG101 signal (n = 9–11 per group). (h) Individual (circle) and mean (bar) fold changes of densitometric quantification of EV‐eNAMPT signal normalized to TSG101 (n = 9–11 per group). Data in (b), (d), (g), and (h) represents the mean ± SEM, *p < 0.05, **p < 0.01. Post‐exercise expressed in relation to pre‐exercise (dashed line)
