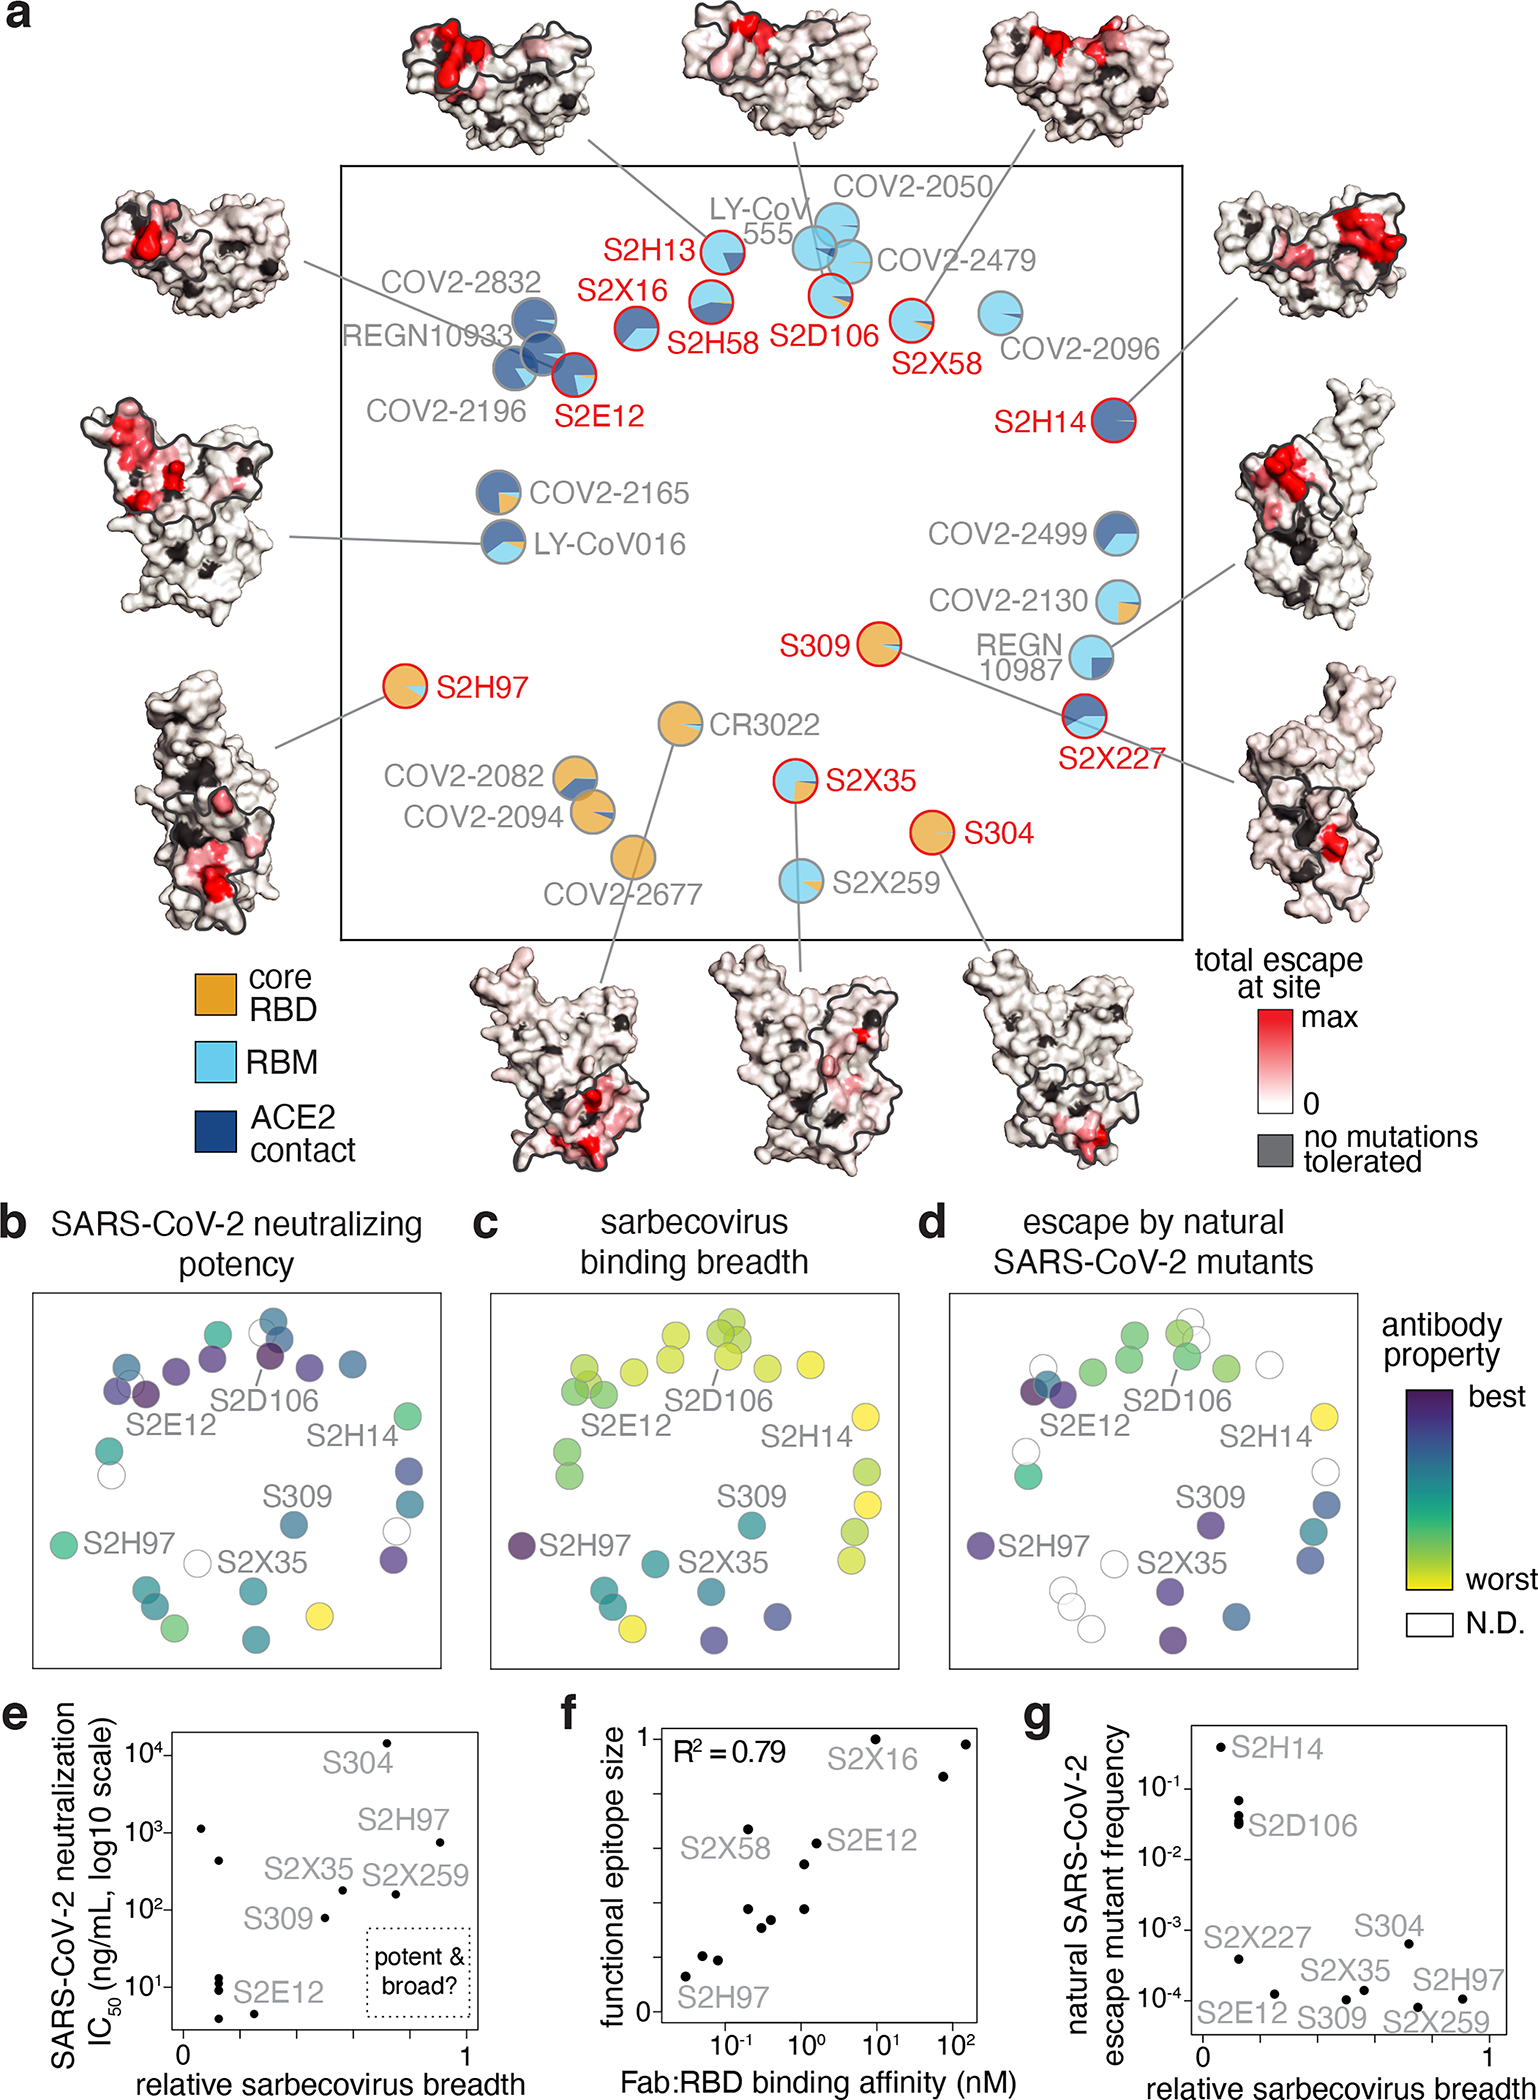
Fig. 4. Antibody epitope, potency, breadth, and escapability.

a, Multidimensional scaling projection of similarities in antibody binding-escape maps from this (red) and prior (gray) studies. Pie charts illustrate the RBD sub-domains where mutations confer escape (bottom left). Structural projections of escape arrayed around the perimeter (scale bar, bottom right), with gray outlines tracing structural footprints. b-d, Projected epitope space from (a) annotated by antibody properties. For each property, antibodies are colored such that purple reflects the most desirable antibody (scale bar, right): most potent neutralization (log10 scale), highest breadth, and lowest natural frequency of escape mutants (log10 scale). e, Relationship between SARS-CoV-2 neutralization potency and sarbecovirus breadth for antibodies in this study and S2X25937. f, Relationship between functional epitope size and SARS-CoV-2 RBD binding affinity. g, Relationship between natural SARS-CoV-2 escape mutant frequency (Extended Data Fig. 3c) and sarbecovirus breadth.
