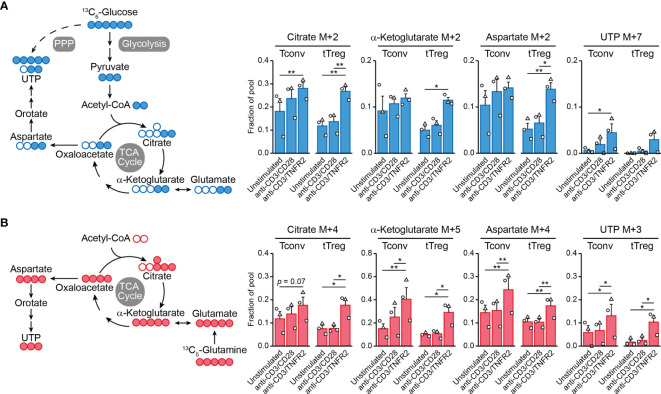
Figure 2.
TNFR2 costimulation regulates Tconv and tTreg metabolism. Tconvs and tTregs were sorted as in Figure 1 and pre-expanded for 1 week. Subsequently, cells were restimulated as indicated for 24 h in the presence of IL-2 and either [13C6]-glucose (A) or [13C5]-glutamine (B) and analyzed by liquid chromatography–mass spectrometry (LC–MS) to trace 13C-labeled metabolites. (A, B) Left panels: schematic diagrams of the fate of 13C in metabolic pathways following [13C6]-glucose uptake (blue) or [13C5]-glutamine uptake (red), including glycolysis, the TCA cycle, the pentose phosphate pathway (PPP) and nucleotide synthesis. (A, B) Right panels: quantifications of 13C-labeled (M+) citrate, α-ketoglutarate (both TCA cycle), aspartate and UTP (both nucleotide synthesis) as fractions of the pool. M+7 was shown for UTP in the [13C6]-glucose tracer experiment, as incorporated 13C originated from aspartate as well as PPP-derived ribose. Two-way ANOVA with Tukey’s post hoc test was used for statistical analysis (*p < 0.05, **p < 0.01). Data are presented as mean ± SEM and data points are depicted as unique symbols per donor. Additional information is described in the Supplementary Methods .

