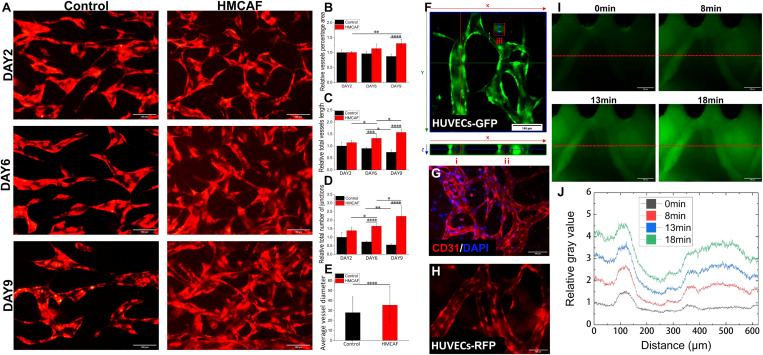
FIG. 2.
Vascular function evaluation of self-assembled microvascular networks. (a) The image of blood vessel growth over time under control (HUVECs-RFP single culture) and HMCAF (HUVECs-RFP/HMCAF co-culture) conditions; scale bar: 100 μm. (b)–(d) Under different culture conditions, quantitative results of relative vessel percentage area, relative total vessel length, and relative total number of junctions (compared with the day 2 control group, n = 3). (e) Average vessel diameter of day 6 (n = 3). (f) Confocal cross-sectional view of the blood vessel and the cross-sectional diameter of some blood vessels [(i) 28.4 μm; (ii) 29.8 μm; and (iii) 7.6 μm]; scale bar: 100 μm. (g) CD31 immunofluorescence staining of the self-assembled microvascular networks (CD31, red and DAPI, blue); scale bar: 100 μm. (h) Sprouting vessel morphology in the matrix area of HMCAF (HUVECs-RFP, day 12); scale bar: 100 μm. (i) and (j) The relative fluorescence intensity distribution along the red dotted line at different time points after perfusing the blood vessel with FITC-dextran (70 kDa, green); scale bar: 100 μm.

