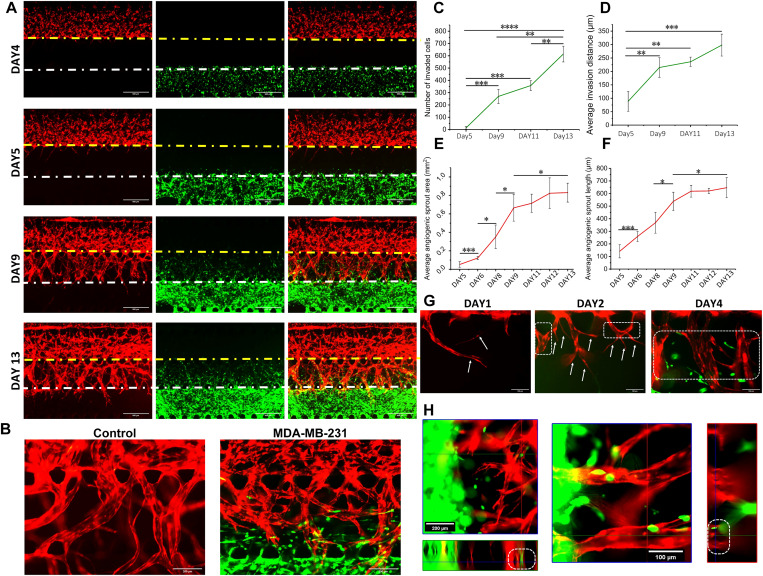
FIG. 3.
Images and analyses of the self-assembled vascularized breast cancer model. (a) The model was imaged on day 4–day 13 under the fluorescence microscope; scale bar: 500 μm. (b) The sprouting vessel morphology under the condition of HUVECs culture alone and HUVECs/MDA-MB-231 co-culture; scale bar: 200 μm. (c) The number of invasions of cancer cells toward the matrix area and (d) the average invasion distance were quantified, taking the pre-existing microvessel region boundary as a starting point. (e) The average sprout area and (f) the average sprout length of the neovascularization toward the matrix region were quantified. (g) The images of angiogenic sprouting on days 5, 6, and 8; white arrow: tip cells; white dashed box: stalk cells; and scale bar: 100 μm. (h) Confocal imaging of the matrix area in the model showed that the cancer cells had performed intravasation (white dashed box); scale bar: 200 (left) and 100 μm (right). HUVECs: with RFP, MDA-MB-231: with GFP, and HMCAF: no fluorescence; (c)–(f): n = 3.

