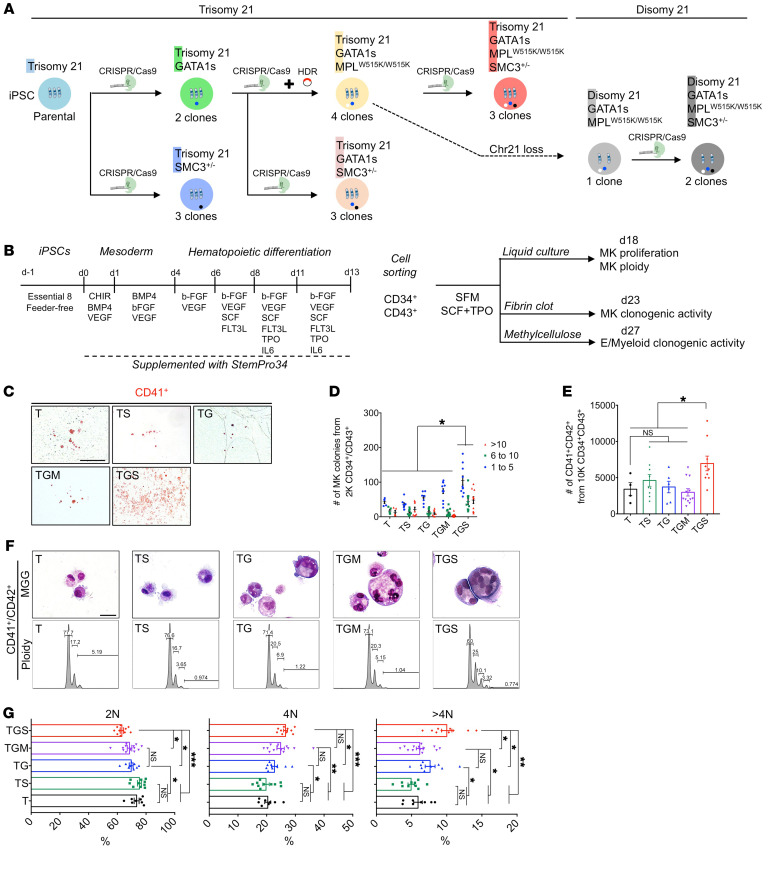
Figure 1. GATA1s cooperates with SMC3+/– to increase MK clonogenic potential, proliferation, and polyploidization.
(A) Schematic overview of the iPSC clones generated by a stepwise introduction of GATA1s, MPLW515K, and SMC3+/–, using CRISPR/Cas9. Bold letters highlight the abbreviation used hereafter. The number of clones obtained for each genotype and subjected to MK differentiation studies is indicated. The dashed arrow indicates the isogenic D iPSC clone harboring GATA1s and MPLW515K mutations randomly obtained through loss of 1 chromosome 21. (B) Schematic overview of the hematopoietic differentiation method used and the subsequent MK phenotypic characterization. (C) Representative images of CFU-MK colonies. Scale bar: 500 μm. (D) Histogram of the number of CD41+ colonies obtained from 2000 CD34+CD43+ in fibrin clot assay. (E) Histogram of the number of CD41+CD42+ MKs obtained from 10,000 CD34+CD43+ in liquid culture assay. Data are represented as mean ± SEM; n = 3–4. The number of clones tested per genotype was as follows: T/parental = 1; TS = 3; TG = 2; TGM = 4; TGS = 3. (F) May-Grünwald-Giemsa (MGG) staining (E, upper panels) and ploidy plots (E, lower panels) of iMK according to the indicated genotypes. T and TS CD41+CD42+ showed typically mature micro-MKs with acidophilic cytoplasm, while TG, TGM, or TGS showed large polyploid immature MKs with basophilic cytoplasm. Scale bar: 50 μm. (G) Histograms of the percentages of 2N, 4N, and >4N of iMKs. Data are represented as mean ± SEM; n = 3 to 8. The number of clones tested per genotype was as follows: T/parental = 1; TS = 2; TG = 2; TGM = 4; TGS = 3. Statistical significance was determined using 1-tailed Mann-Whitney U test. *P < 0.05; **P < 0.01; ***P < 0.001.

