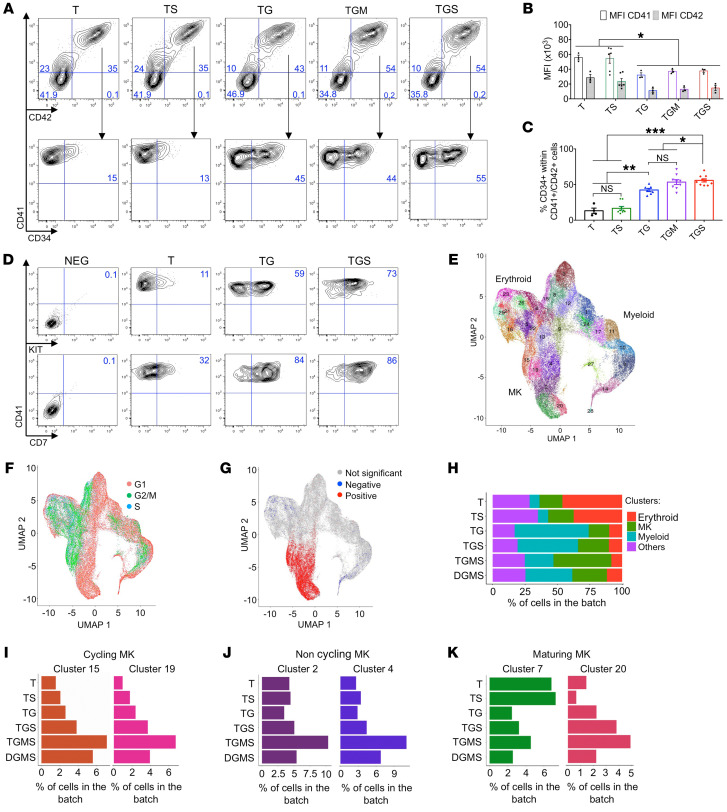
Figure 2. Assessment of iMK differentiation alterations.
(A–D) Immunophenotypes of iMKs for the CD34, KIT, CD7, CD41, and CD42 markers found in DS-AMKL patient blasts. (A) Contour plots showing the expression of CD34, CD41, and CD42 markers. (B) Histogram shows the MFI of CD41 and CD42. (C) Histogram shows the percentage of CD34+CD41+ per total CD41+ population. Data in B and C are represented as mean ± SEM; n = 3–4. The number of clones tested per genotype was as follows: T/parental = 1; TS = 2; TG = 2; TGM = 3; TGS = 3. Statistical significance was determined using 1-tailed Mann-Whitney’s U test: *P < 0.05; **P < 0.01; ***P < 0.001. (D) Representative contour plots of KIT and CD7 expression in the iMK population from 2 independent experiments. (E and F) scRNA-Seq of CD43+ iPSC-derived hematopoietic cells at day 13 of culture. (E) UMAP integration of cells from all conditions. Clusters were defined using the Louvain algorithm and numbered and labeled with unique colors. (F) UMAP integration with cells colored according to the predicted cell-cycle stage (Seurat method). (G) UMAP integration with cells colored according to the enrichment in a MK signature. Red, cells are significantly enriched for the signature; blue, cells are significantly depleted for the signature; gray, no significant enrichment. (H) Bar plot shows the proportion of cells in the indicated hematopoietic lineages for each condition. (I) Bar plots of the proportion of cells in the 2 clusters of cycling MKs. (J) Bar plots of the proportion of cells in the 2 clusters of noncycling MKs. (K) Bar plots of the proportion of cells in the 2 clusters of maturing MKs. Cluster 7 represents normal maturing MKs. Cluster 20 represents an abnormal MK population.

