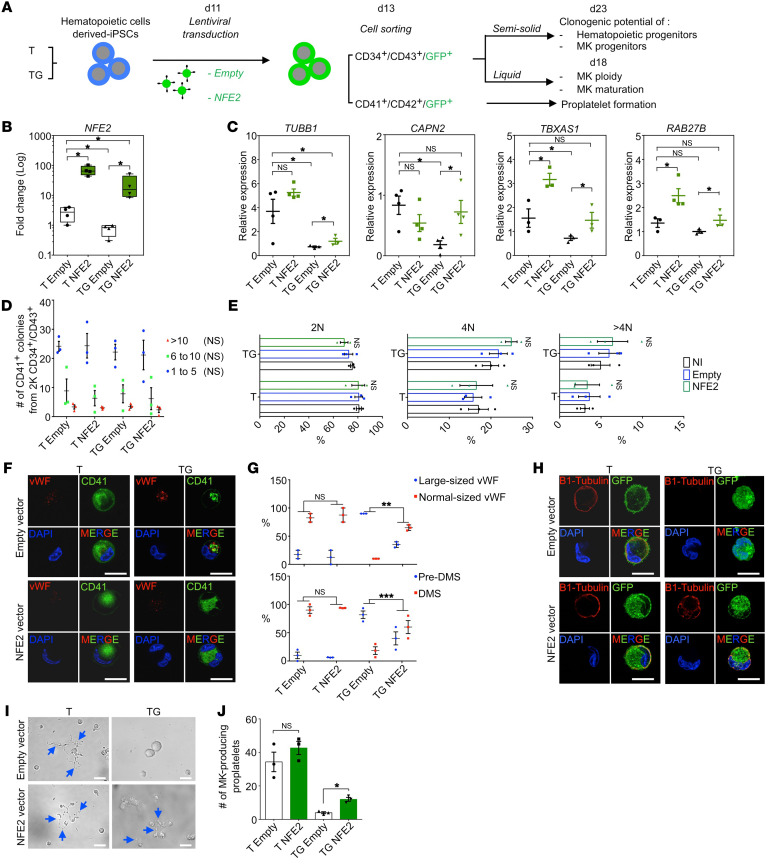
Figure 6. NFE2 overexpression in TG MK partially rescues maturation and PPT defects.
(A) Schematic overview of NFE2 overexpression strategy in T and TG iMKs and of subsequent phenotypic studies. (B) Validation by RT-qPCR of NFE2 overexpression in T and TG iMKs. (C) RT-qPCR analyses of the known NFE2 target gene expression with empty or NFE2 lentiviral vectors. (D) Effect of NFE2 overexpression on the clonogenic potential of T and TG iMKs. (E) Effect of NFE2 overexpression on the ploidization of T and TG iMKs. (F) Confocal analyses of NFE2 overexpressing MK in T and TG for CD41 and vWF expression. Scale bars: 50 μm. (G) Histograms of the percentages of MKs with normal or large-sized vWF (upper panel) and the percentages of MKs with pre-DMS or DMS (lower panel) according to the absence (empty) or presence of NFE2 lentiviral vector. Quantifications were performed on 20 MKs from 3 independent experiments. (H) Confocal analyses of β1-tubulin expression in T- and TG-derived MKs according to the absence (empty) or presence of NFE2 lentiviral vector. Scale bars: 50 μm. (I) Representative microphotographs of CD41+CD42+ MKs under PPT formation assay. Note the presence of PPT-forming MKs (blue arrows) in the absence or presence of NFE2 lentivector for the T, while in TG, the presence of PPT-forming MK was observed only in the presence of NFE2 lentivector (blue arrows). Scale bars: 50 μm. (J) Histogram of the number of PPT-forming MK shown in I according to the compared genotypes. Data are represented as mean ± SEM; n = 3. Statistical significance was determined using 1-tailed Mann-Whitney’s U test. *P < 0.05; **P < 0.01; ***P < 0.001.

